A Data-Driven and Legal Look at the South’s Most Dangerous Intersections
 Intersections are among the most hazardous locations on American roads. In the Southern United States, where high-speed rural highways meet rapidly expanding urban environments, the risk is especially acute. This five-year analysis identifies the most hazardous intersections in ten Southern states, based on fatal and serious injury crash data from 2019 to 2023.
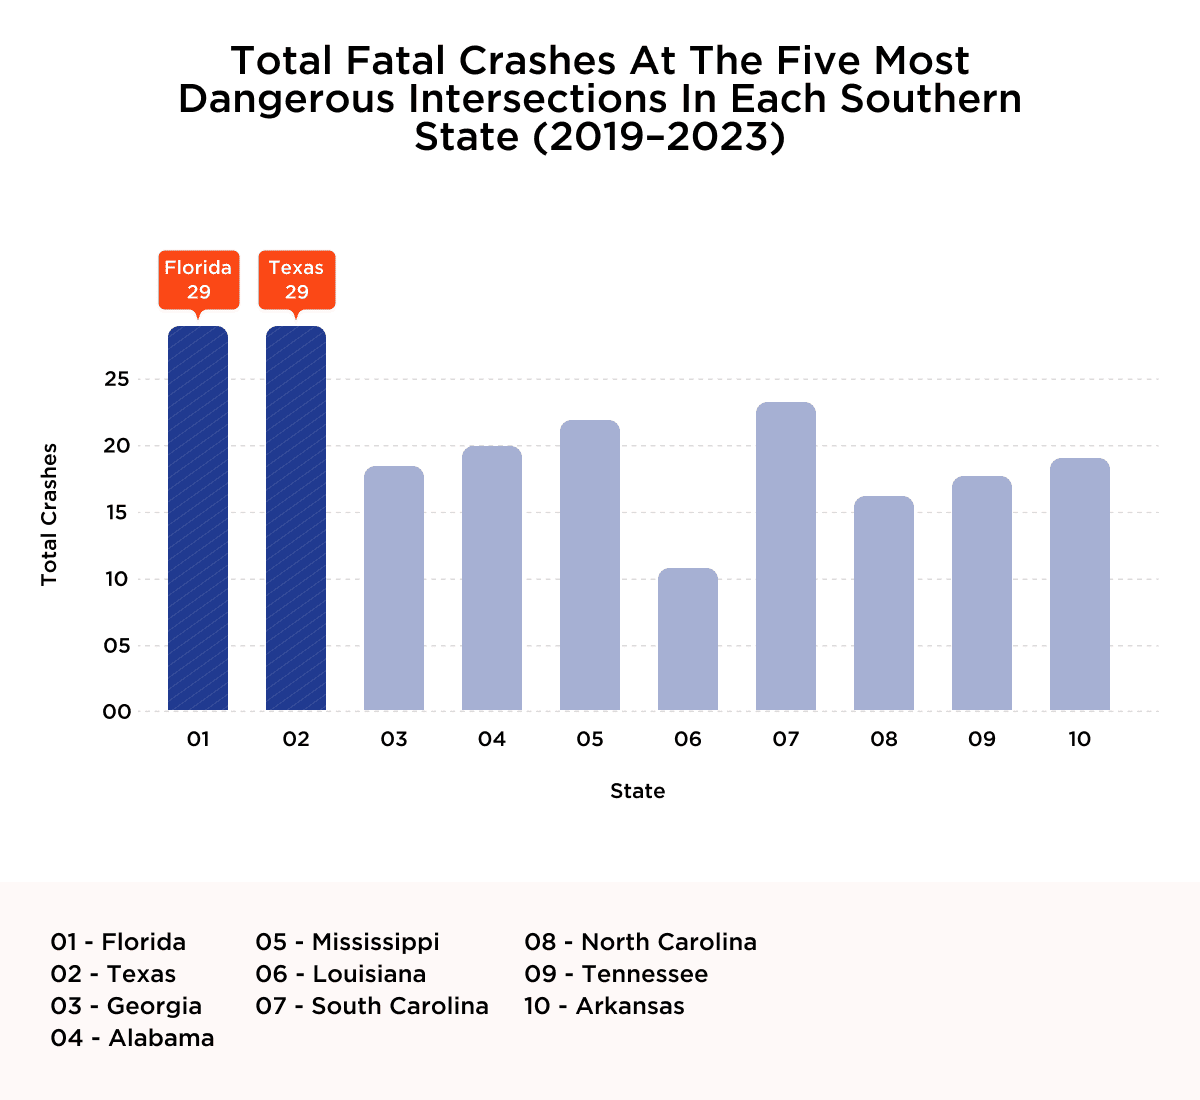
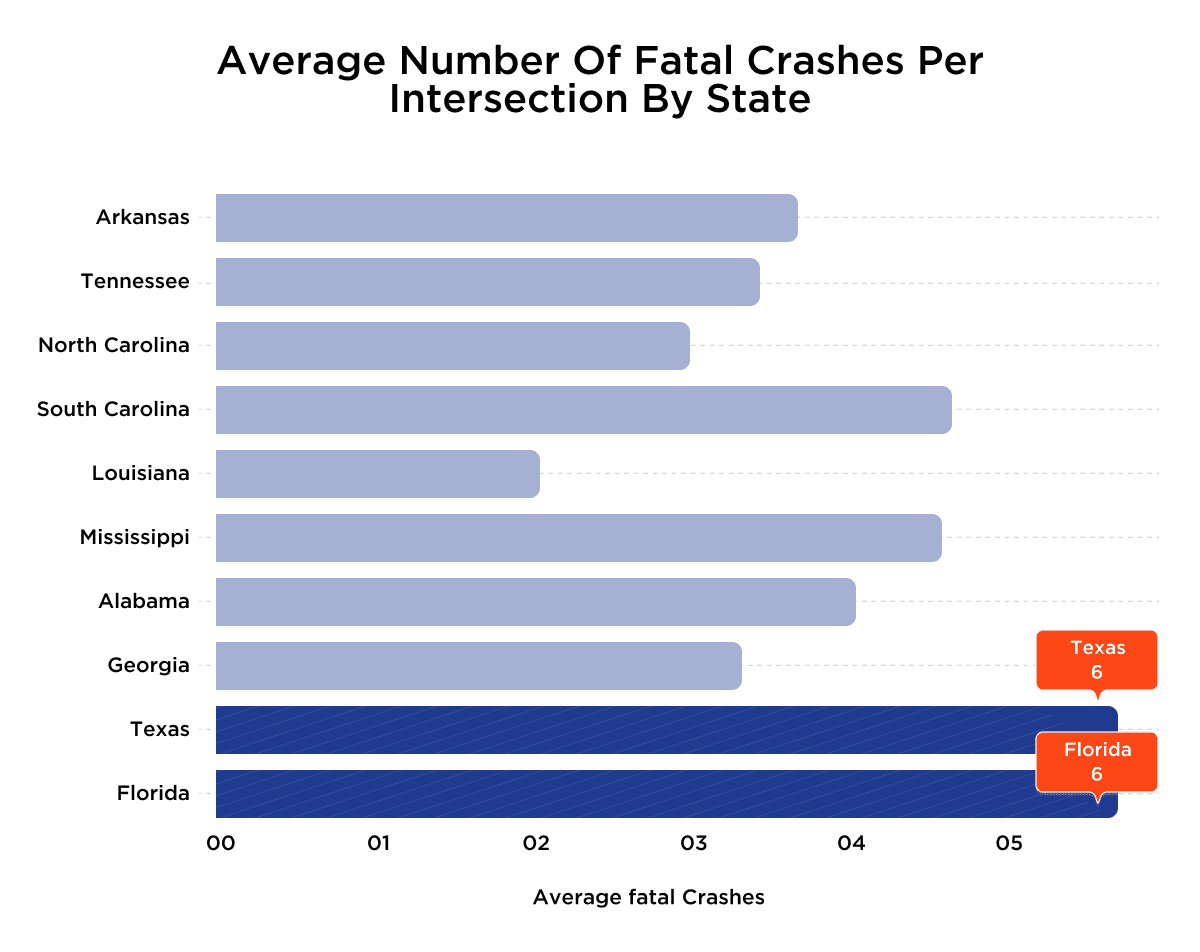
Over 100 fatal crashes occurred in intersections across Florida, Texas, Georgia, Alabama, Mississippi, Louisiana, South Carolina, North Carolina, Tennessee, and Arkansas. Many of these sites have histories of repeated crashes, underscoring systemic safety issues.
When known hazards go uncorrected, the consequences raise serious questions about accountability and liability. This report is designed to empower drivers, inform public officials, and support car accident attorneys in identifying the intersections where preventable crashes continue to occur. It calls for meaningful action to improve safety and reduce liability across the region’s most hazardous roadways.
Sources: Crash Data Analysis Network (CDAN) and FARS
Study Argument
Every day, millions of Southern drivers pass through intersections without incident. Yet, as crash data consistently reveals, these common roadway features are also some of the deadliest. Intersections involve multiple conflict points where speed, distraction, and poor visibility can intersect, resulting in tragic consequences.
As populations grow, cities expand, and rural roads carry more traffic, the margin for error becomes increasingly narrow. Tourist influxes, commercial trucking, and aging infrastructure only compound the risk.
Study Purpose and Methodology
Our Florida personal injury lawyers engaged in this research with a clear mission:
- To pinpoint intersections with a history of fatal and severe injury crashes.
- To uncover the underlying causes that make these locations disproportionately dangerous.
- To supply data that can support legal claims, public safety initiatives, and targeted infrastructure reform.
Our researchers analyzed publicly accessible crash databases, including federal and state-level reports, to determine the five intersections in each state with the highest number of fatal incidents. Where available, serious injury data were also reviewed to provide additional context.
- The Crash Data Analysis Network (CDAN): A federal tool aggregating nationwide crash statistics by intersection and county-level resolution.
- The National Highway Traffic Safety Administration’s FARS tracks every fatal crash in the United States.
- State-level databases and reports from departments of transportation, including:
-
- Similar traffic and safety agencies from all other states were studied.
The dataset was limited to verified public information from official government agencies. To ensure accuracy, irrelevant incidents and duplicate entries were removed.
Florida’s Dangerous Road Reality: Legal and Safety Implications
Florida consistently ranks among the most dangerous states in the U.S. for traffic fatalities. According to the Florida Department of Highway Safety and Motor Vehicles, over 3,500 people die each year on Florida roads, with a significant number of those fatalities occurring at intersections. These sites are especially prone to T-bone crashes, left-turn collisions, and pedestrian impacts, often due to complex road layouts, limited visibility, or signal timing issues.
Several factors make Florida particularly high-risk. As the third most populous state and the top U.S. travel destination, Florida hosts more than 100 million annual visitors. This results in a volatile driving environment where local commuters, elderly drivers, and tourists unfamiliar with the roads all converge on the same fast-moving corridors. In high-traffic areas like Orlando, Miami, Tampa, and Gainesville, state and federal routes such as SR-50, US-1, and I-75 often intersect at outdated or overloaded junctions.
Florida’s no-fault insurance system covers minor crashes through Personal Injury Protection (PIP), but in serious collisions — like those detailed in this study — victims may pursue full personal injury claims. These are typically filed when the injuries meet a “serious injury threshold” or when negligence is evident in road maintenance, signage, or visibility. That distinction is crucial for victims injured at hazardous intersections, where public entities may share legal liability.
As a Florida-based personal injury law firm, Meldon Law’s car accident lawyers have witnessed firsthand how these dangerous intersections lead to life-altering crashes. When cities or counties fail to fix dangerous intersections, they may be held liable under Florida law. Documented histories of crashes, ignored safety reports, or poor maintenance can form the basis for governmental liability claims. Meldon Law’s focus on intersection safety aims to create a legal framework that advocates for victims and pressures municipalities to act before more lives are lost nationwide.
State-by-State Breakdown of the South’s Deadliest Intersections
To fully understand the regional nature of intersection-related crashes, it’s essential to examine where and why these incidents cluster within individual states. In the following breakdown, each of the ten Southern states is explored in detail, highlighting their five most fatal intersections from 2019 to 2023. Whether in rural blackspots or congested city corridors, these profiles help spotlight where strategic intervention could have the most significant impact.
1. Florida
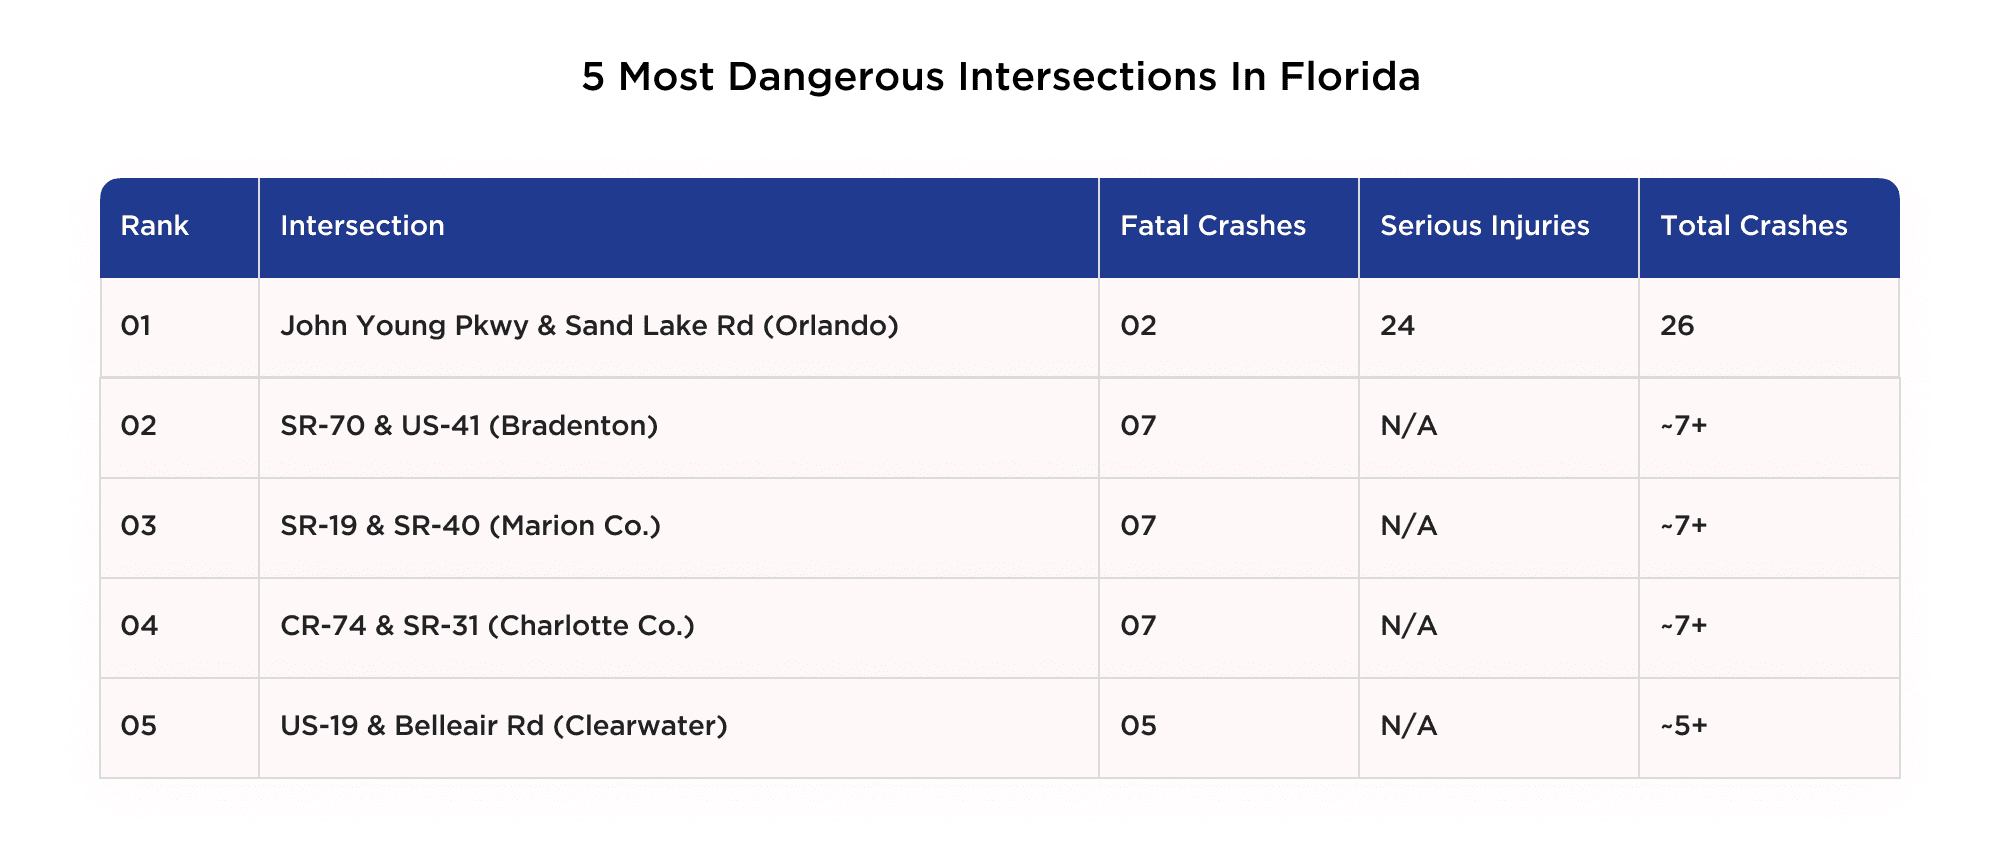
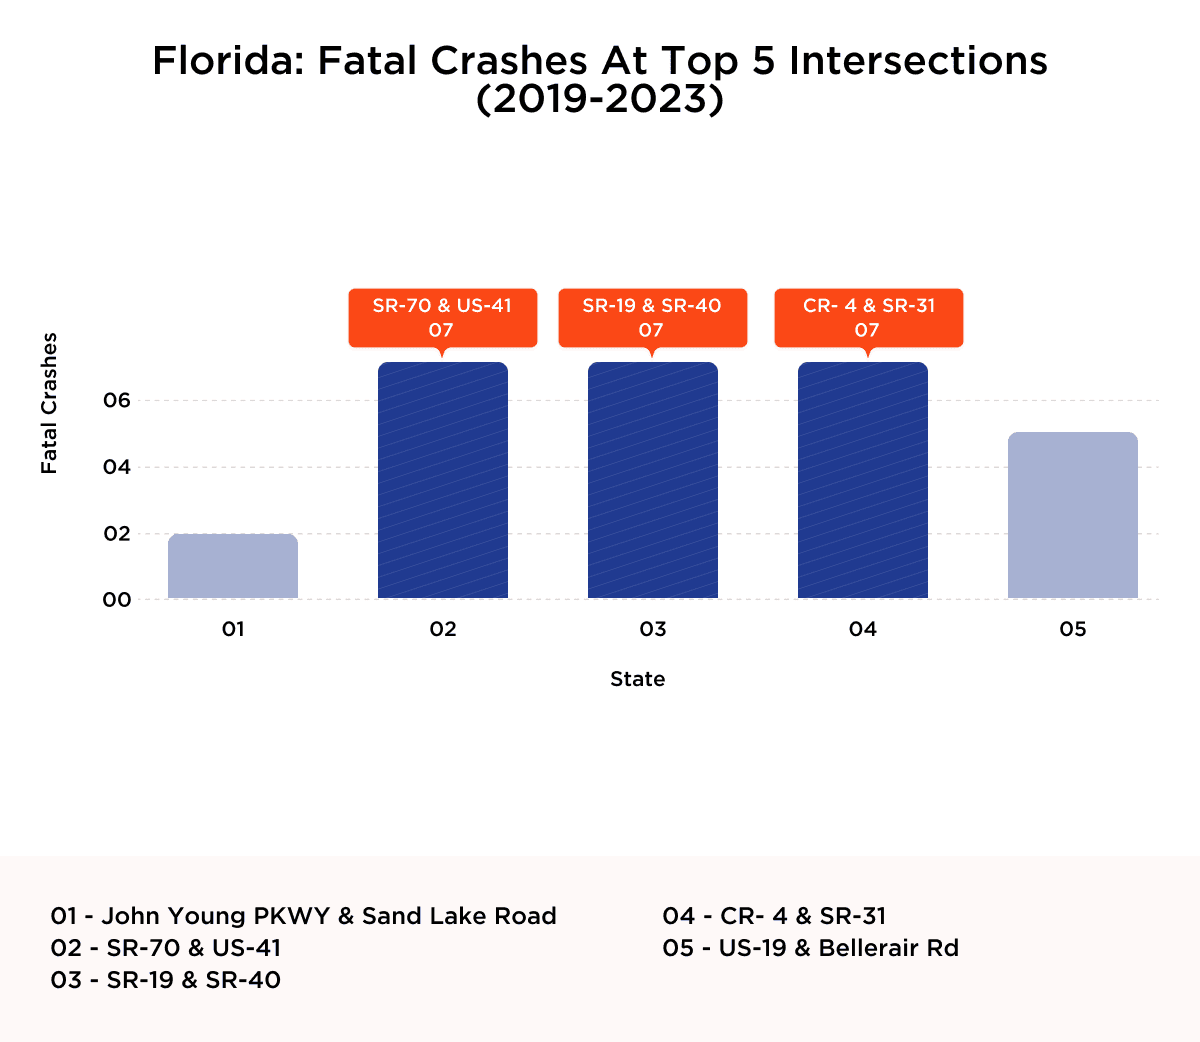
Florida has some of the highest-risk intersections in the South, primarily due to heavy tourism, high traffic volumes, and complex road layouts. Locations like John Young Parkway & Sand Lake Road see repeated serious crashes, often involving out-of-state drivers. When accidents happen at intersections with known patterns of danger, it raises potential legal questions about whether proper warnings, signage, or traffic control measures were in place.
Source: Crash Data Analysis Network (CDAN)
Florida’s intersection crash data paints a clear picture of persistent danger at a handful of major junctions.
Sources: Florida Highway Safety and Motor Vehicles and FARS
Intersections with repeated fatal crashes over several years may indicate a pattern of neglect. When known risks go unaddressed, it can strengthen claims of liability in serious injury or wrongful death cases in Florida. Identifying these patterns is crucial for ensuring people’s safety and maintaining legal accountability.
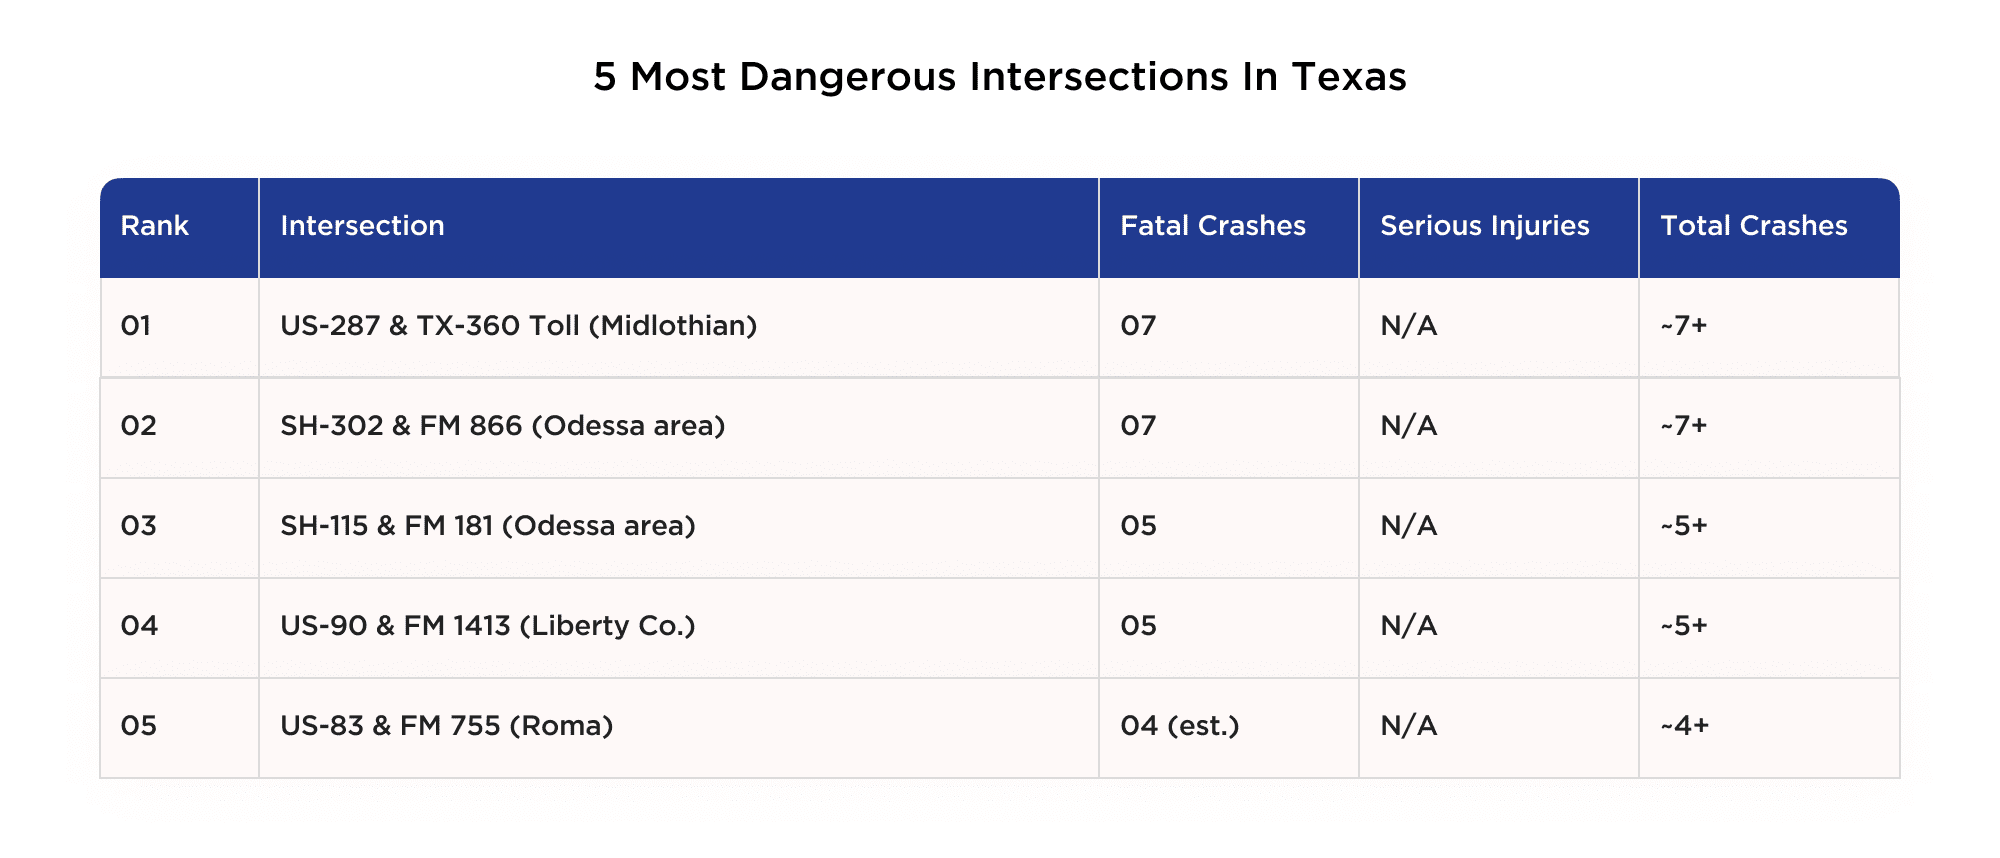
2. Texas
Texas has some of the deadliest intersections in the region, with several sites, particularly near Odessa and Midlothian, logging seven fatal crashes in five years. Heavy truck traffic, high speeds, and minimal traffic control create recurring risk. In these cases, legal scrutiny often centers on whether adequate safety measures were in place given the known volume and severity of collisions.
Source: Crash Data Analysis Network (CDAN)
The chart below reveals a grim consistency: the top two locations, US-287 & TX-360 Toll and SH-302 & FM 866, both experienced seven fatal crashes, making them among the deadliest in the entire Southern region.
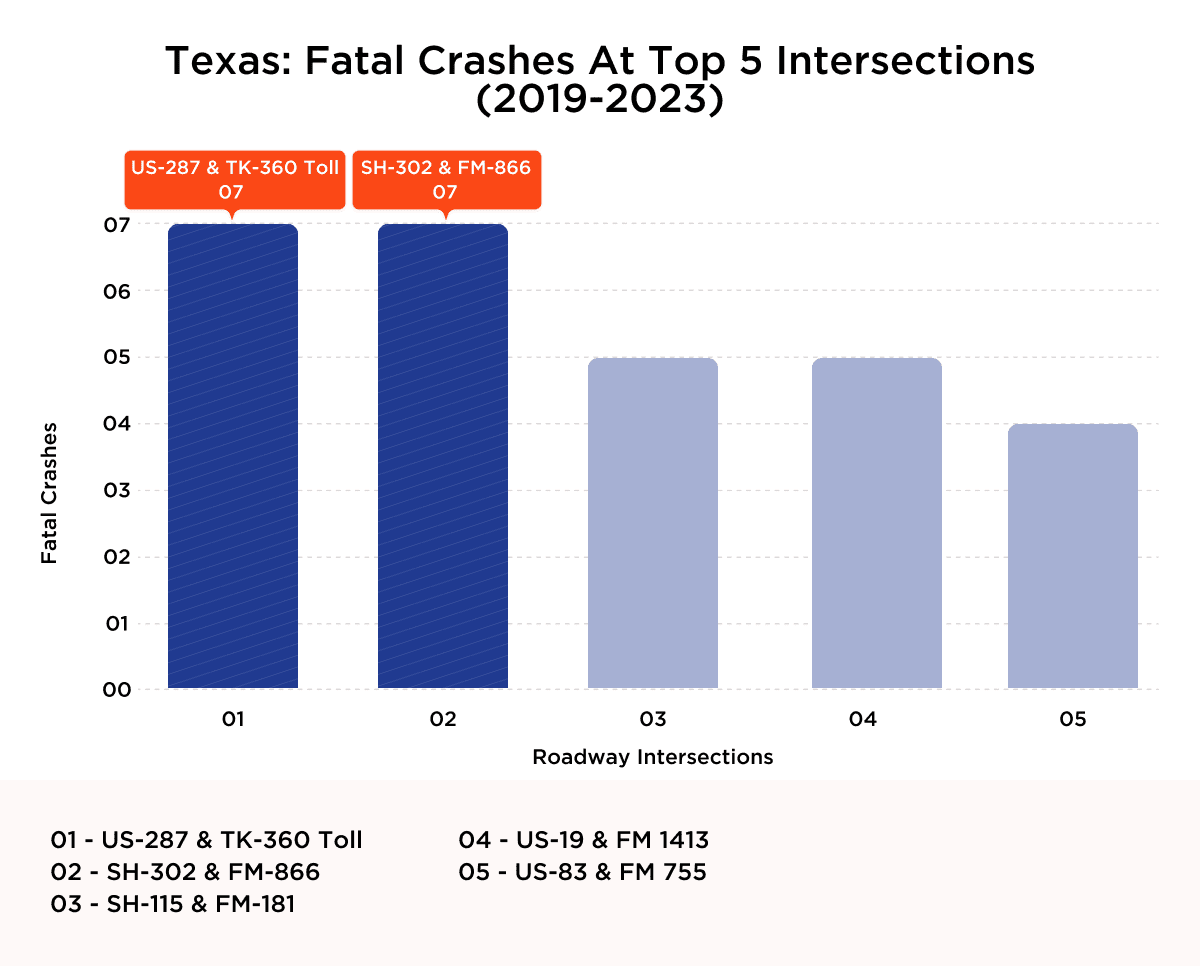
Sources: Texas Department of Transportation and FARS
Recurring crashes in high-risk corridors may point to preventable conditions. In legal terms, the absence of basic safety features, like protected turn lanes or adequate traffic controls, can support claims of negligence when serious injuries or fatalities occur.
3. Mississippi
Mississippi’s most dangerous intersections are often found in rural areas where high-speed travel meets minimal traffic control. Sites like US-98 & MS-63 near Lucedale have seen repeated fatalities. In personal injury cases, these conditions may raise questions about whether appropriate warnings or design standards were in place to protect drivers.
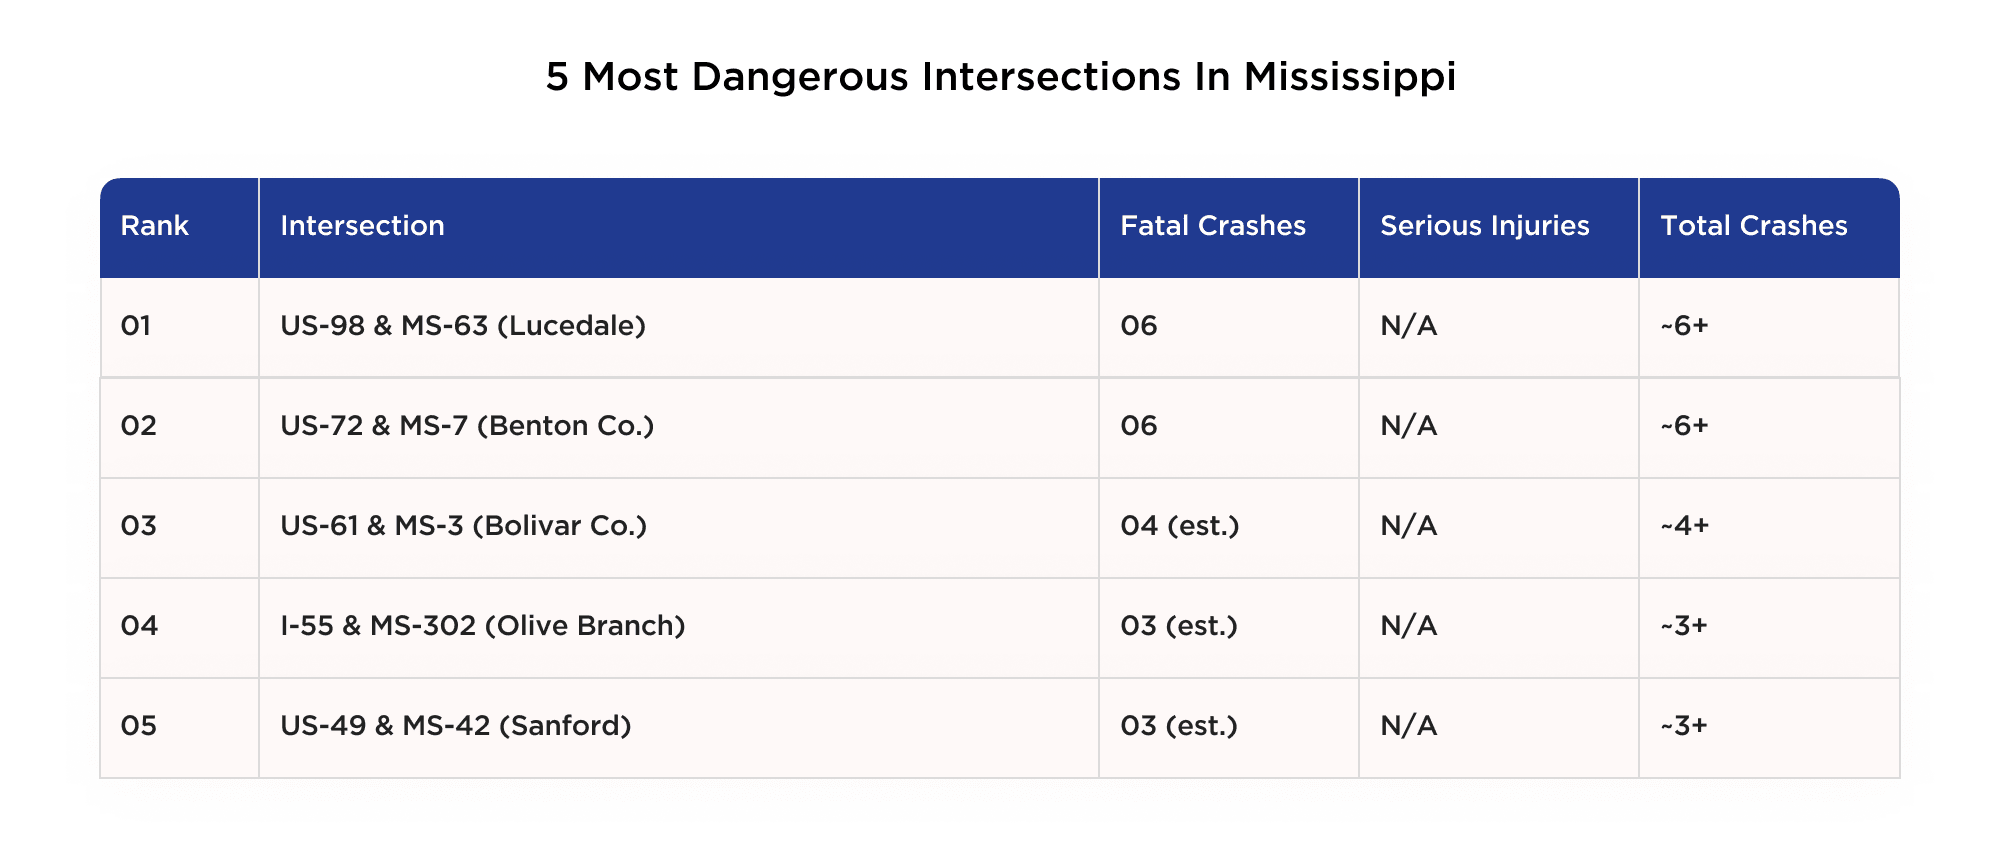
Source: Crash Data Analysis Network (CDAN)
Fatal crash data from US-98 & MS-63 and US-72 & MS-7—each with six deaths—points to a clear pattern of risk. For car accident attorneys, such patterns may support arguments that public agencies failed to address known hazards despite prior incidents.
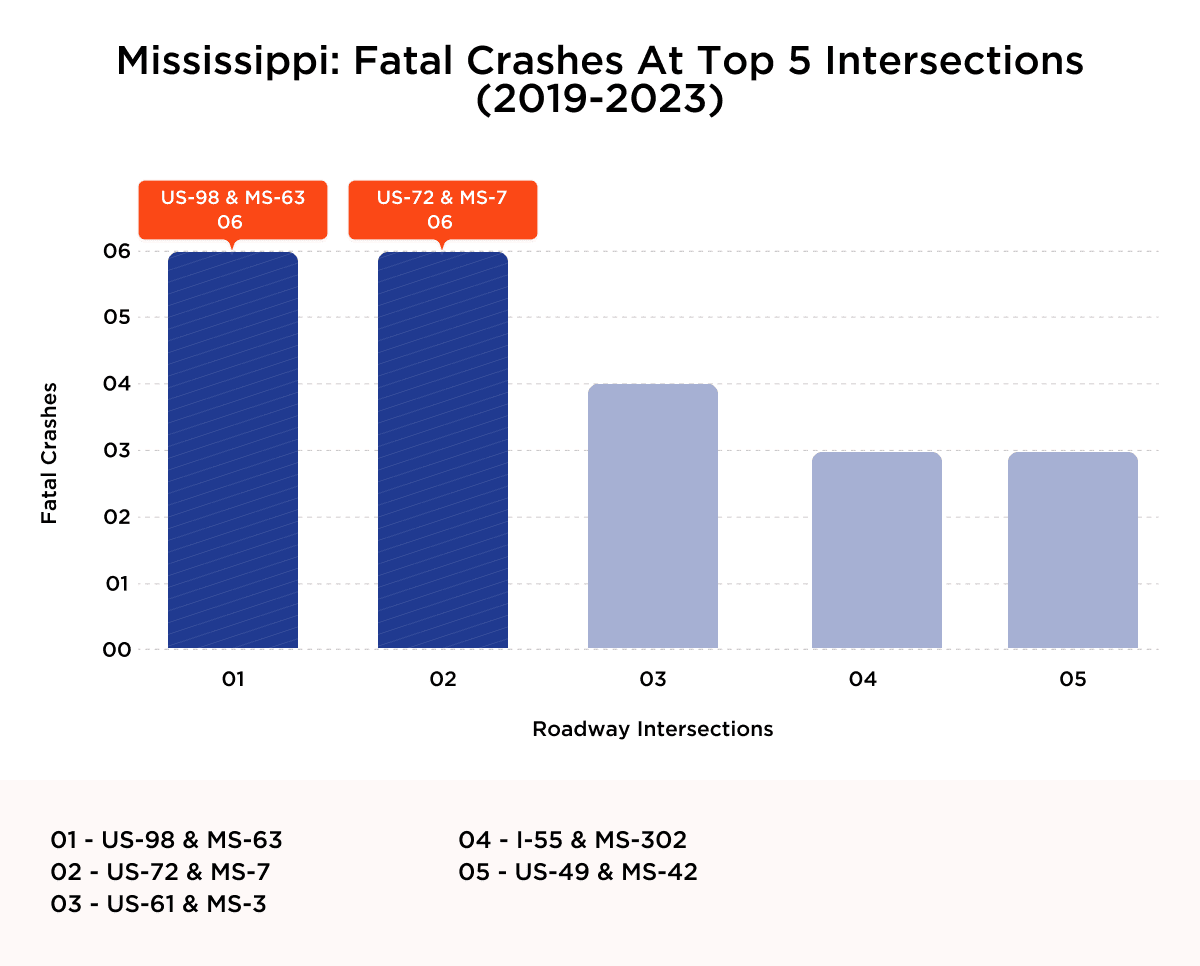
Sources: Crash Data Analysis Network (CDAN) and FARS
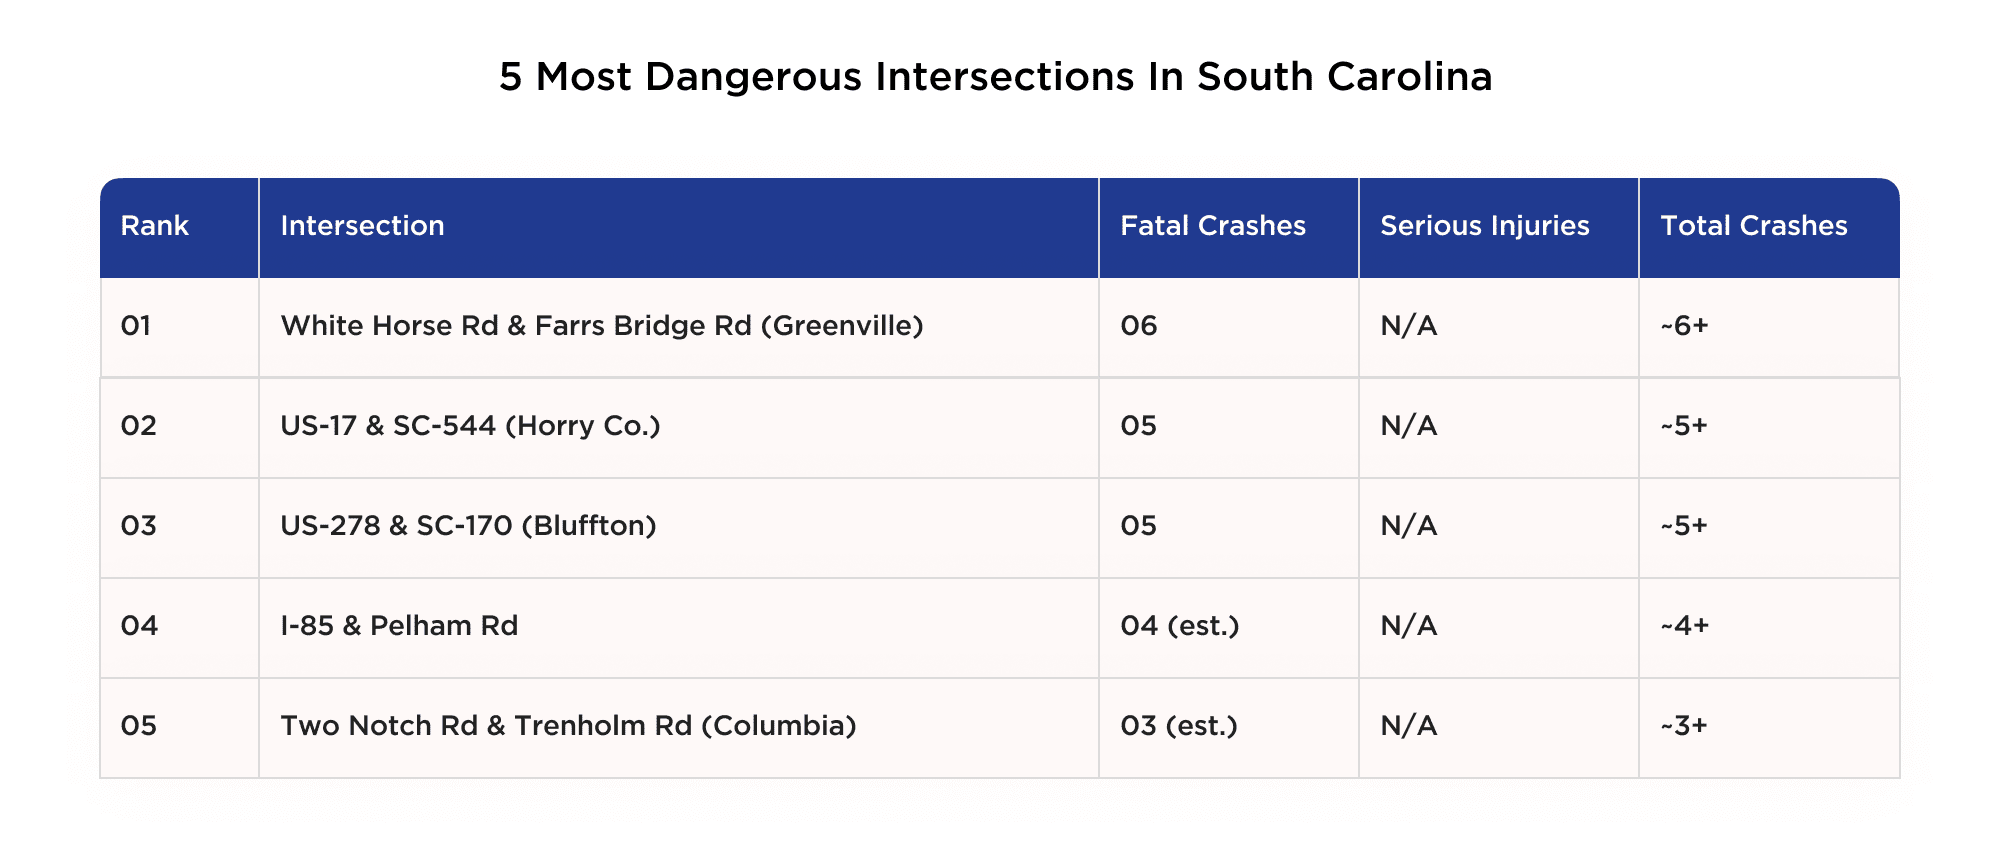
4. South Carolina
South Carolina’s highest-risk intersections, such as White Horse Road and Farrs Bridge Road, show repeated crashes in areas where traffic has outgrown outdated designs. In growing regions like Greenville and along coastal corridors such as US-17, legal questions often arise regarding whether state or local agencies have failed to upgrade infrastructure despite increased traffic volume and known risks.
Source: Crash Data Analysis Network (CDAN)
Crash data shows six fatalities at White Horse Rd & Farrs Bridge Rd, with other intersections like US-17 & SC-544 also reporting multiple deaths. When serious crashes repeat at the exact locations, it can support claims that responsible agencies failed to act on foreseeable risks.
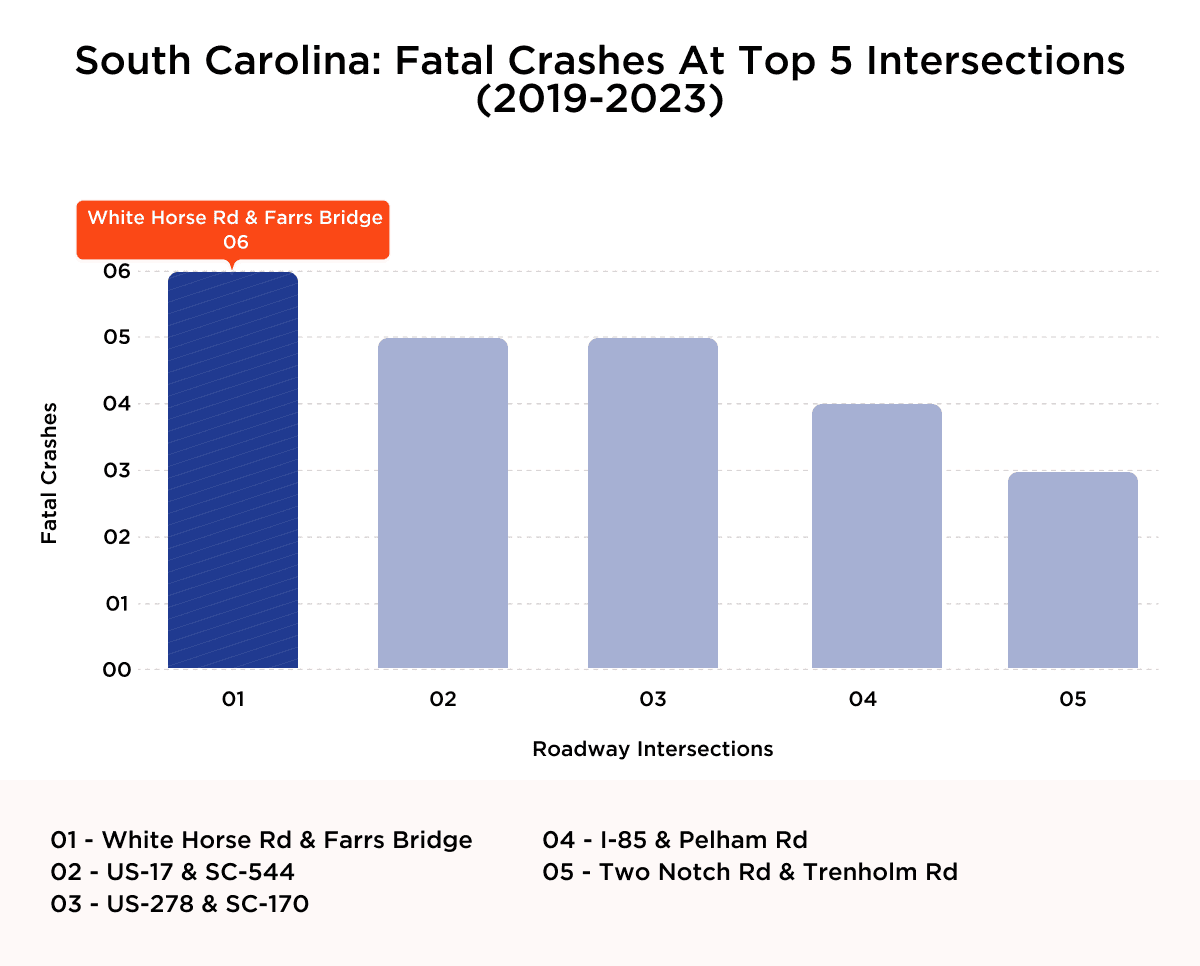
Sources: South Carolina State Government and FARS
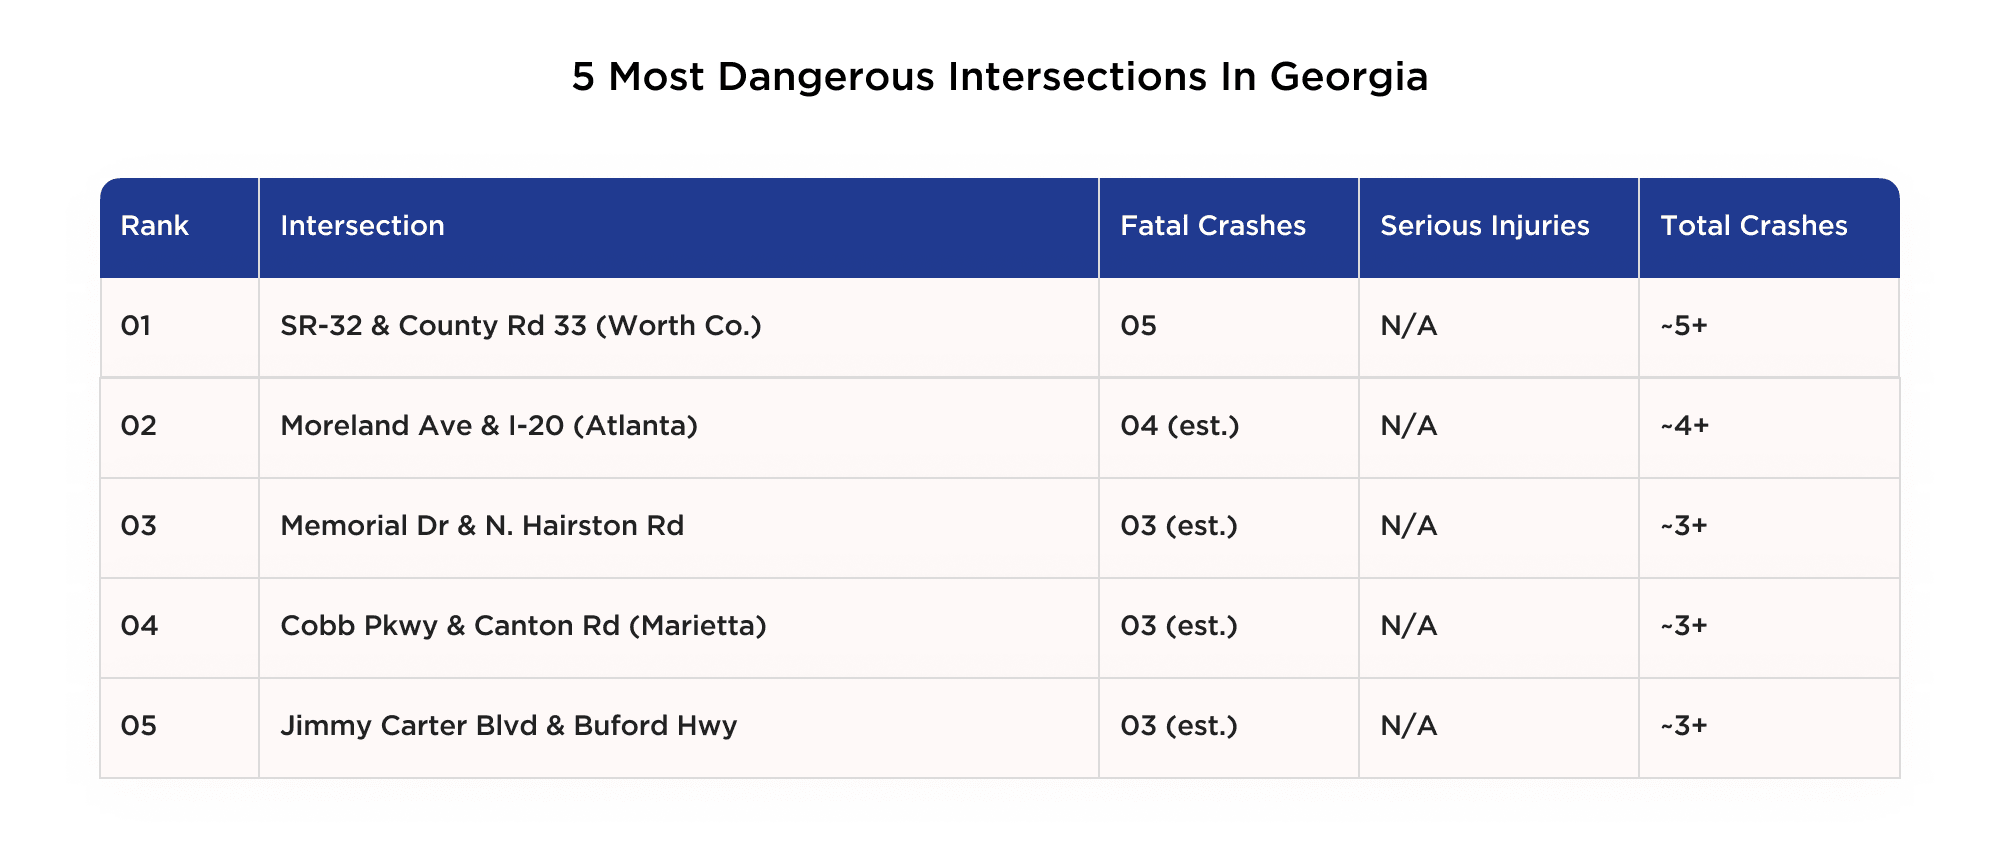
5. Georgia
Georgia’s highest-risk intersections show fatal crashes in both rural and urban settings. Rural roads, such as those in Worth County, often lack adequate signage, while metro Atlanta sites like Moreland Avenue and I-20 face high traffic and complex driving conditions. From a legal standpoint, repeated crashes in either context may point to failures in adapting safety measures to local risk factors.
Source: Crash Data Analysis Network (CDAN)
With both urban and rural environments showing repeated patterns of risk, Georgia has an opportunity to lead by deploying tailored upgrades: rural signaling enhancements on one hand, and smart, congestion-sensitive systems in urban centers on the other.
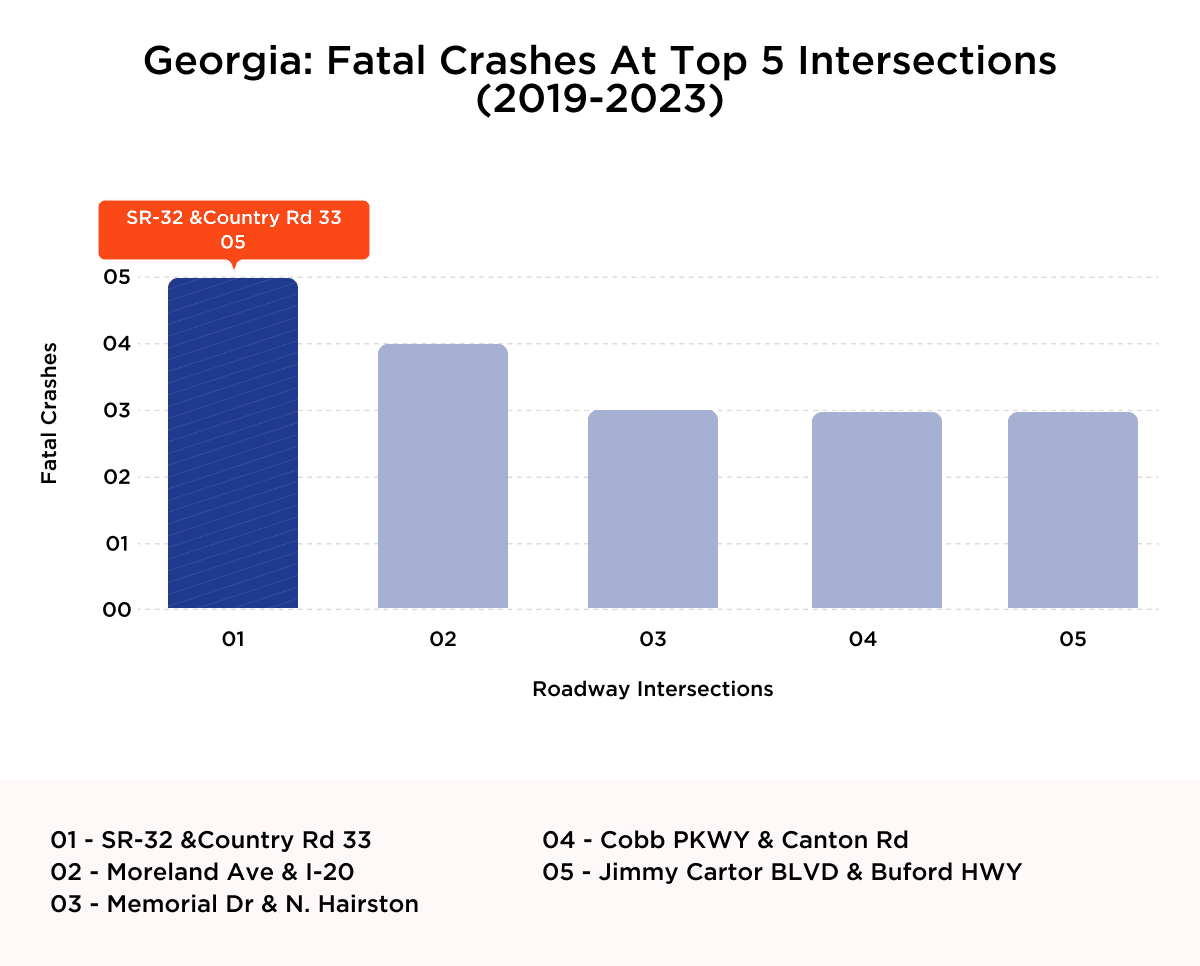
Source: Governor’s Office of Highway Safety and FARS
6. Arkansas
Arkansas’s deadliest intersections are largely rural, with limited signage and outdated controls that contribute to a high frequency of crashes. While urban areas may see more funding, persistent fatalities in rural zones can raise legal concerns about whether known dangers were ignored or under-prioritized by responsible agencies.
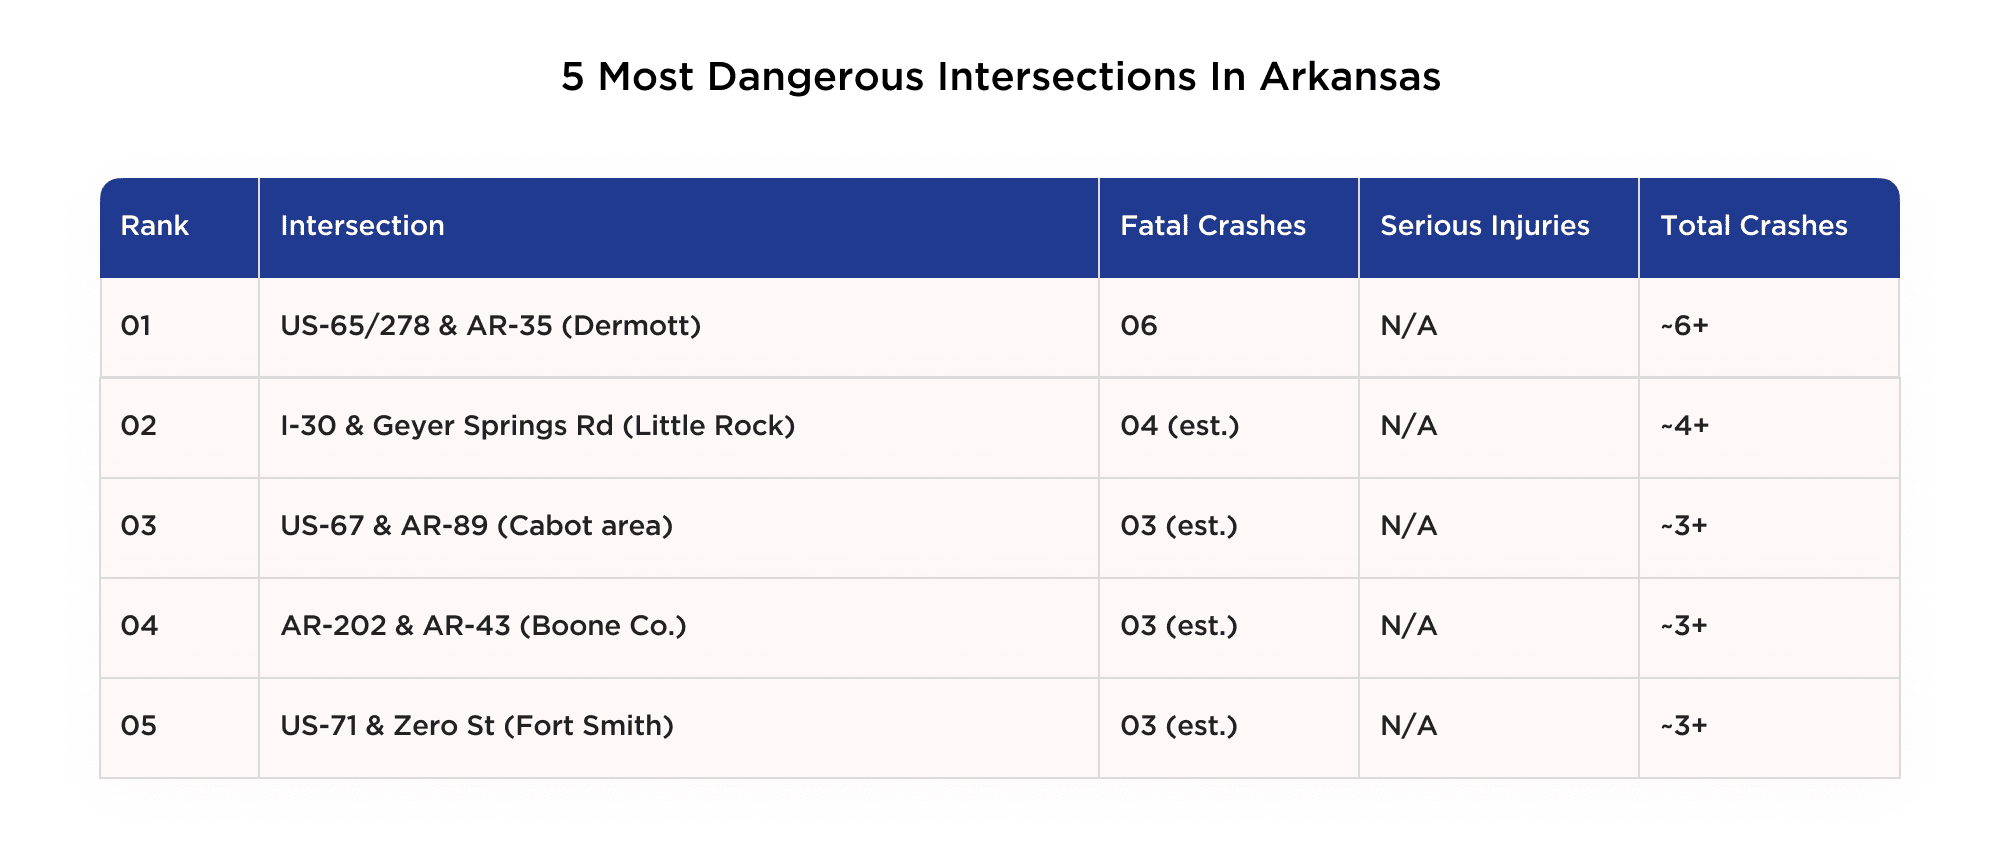
Source: Crash Data Analysis Network (CDAN)
Crash data shows six fatalities at US-65/278 & AR-35, with similar patterns at AR-202 & AR-43 and US-67 & AR-89. Upgrading rural intersections with better lighting, clearer signals, and safer geometry should be a top priority in any statewide safety initiative. When multiple deaths occur at the same rural intersections, it may support claims that officials failed to correct known and ongoing safety risks.
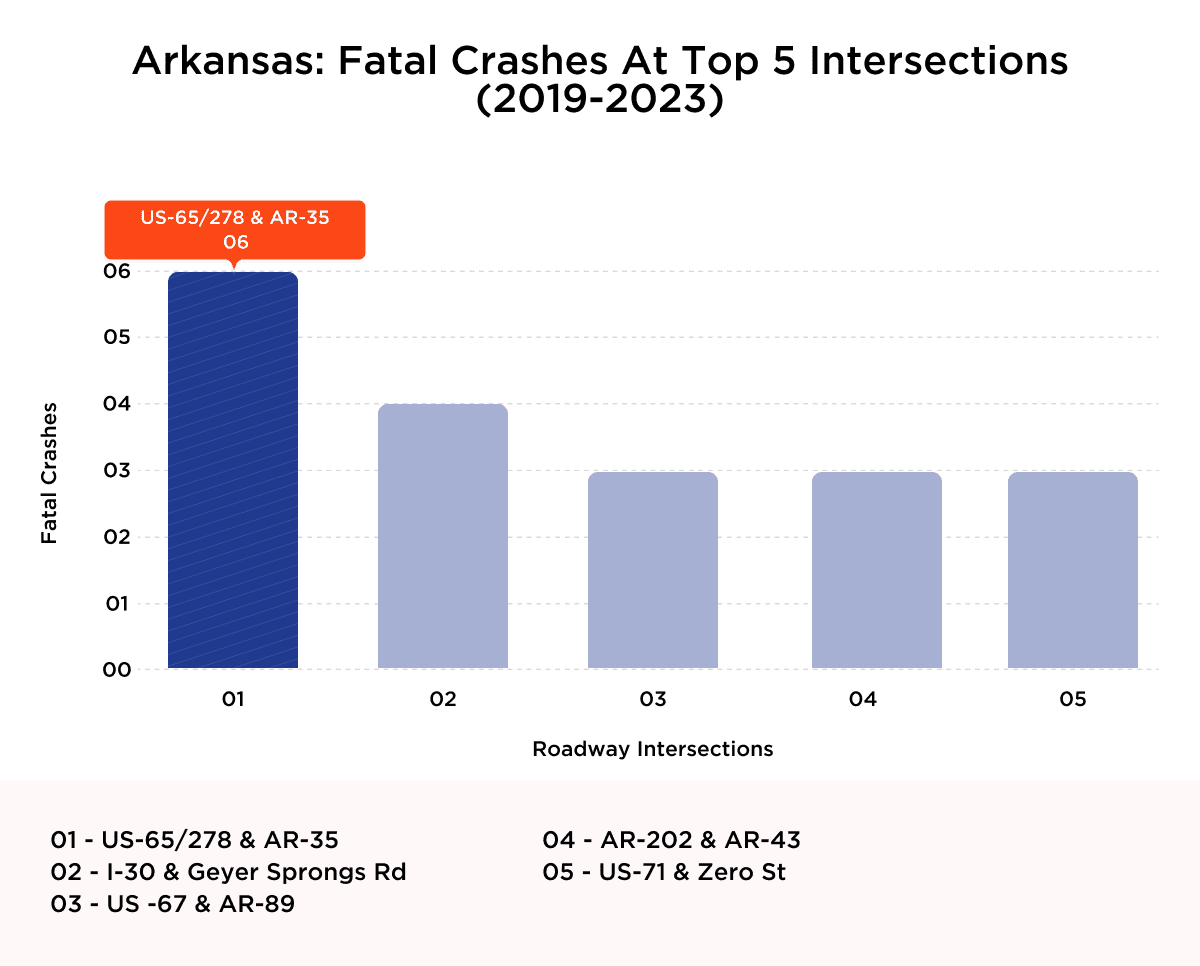
Sources: Arkansas Crash Analytics Tool and FARS
7. Alabama
Alabama’s most hazardous intersections highlight the growing tension between outdated infrastructure and the increasing demands of suburban traffic. Many of these high-fatality locations, such as US-72 & Dug Hill Road in Madison County, sit on the fringes of expanding metropolitan areas where rural design standards still dominate the roadway layout. When serious crashes occur in these known chokepoints, liability may hinge on whether responsible agencies failed to act despite clear warning signs.

Source: Crash Data Analysis Network (CDAN)
Alabama’s data shows seven fatalities at US-72 & Dug Hill Rd alone, with other sites like US-431 & AL-1 also showing repeated deadly crashes. These aren’t isolated incidents. They reflect recurring patterns in areas where traffic growth has outpaced oversight and regulation.
Such trends may indicate missed opportunities to prevent harm where risks were already well-established and strongly suggest the need for forward-looking investment in safety improvements, particularly in growing communities where traffic conditions have already outpaced the roads intended to serve them.
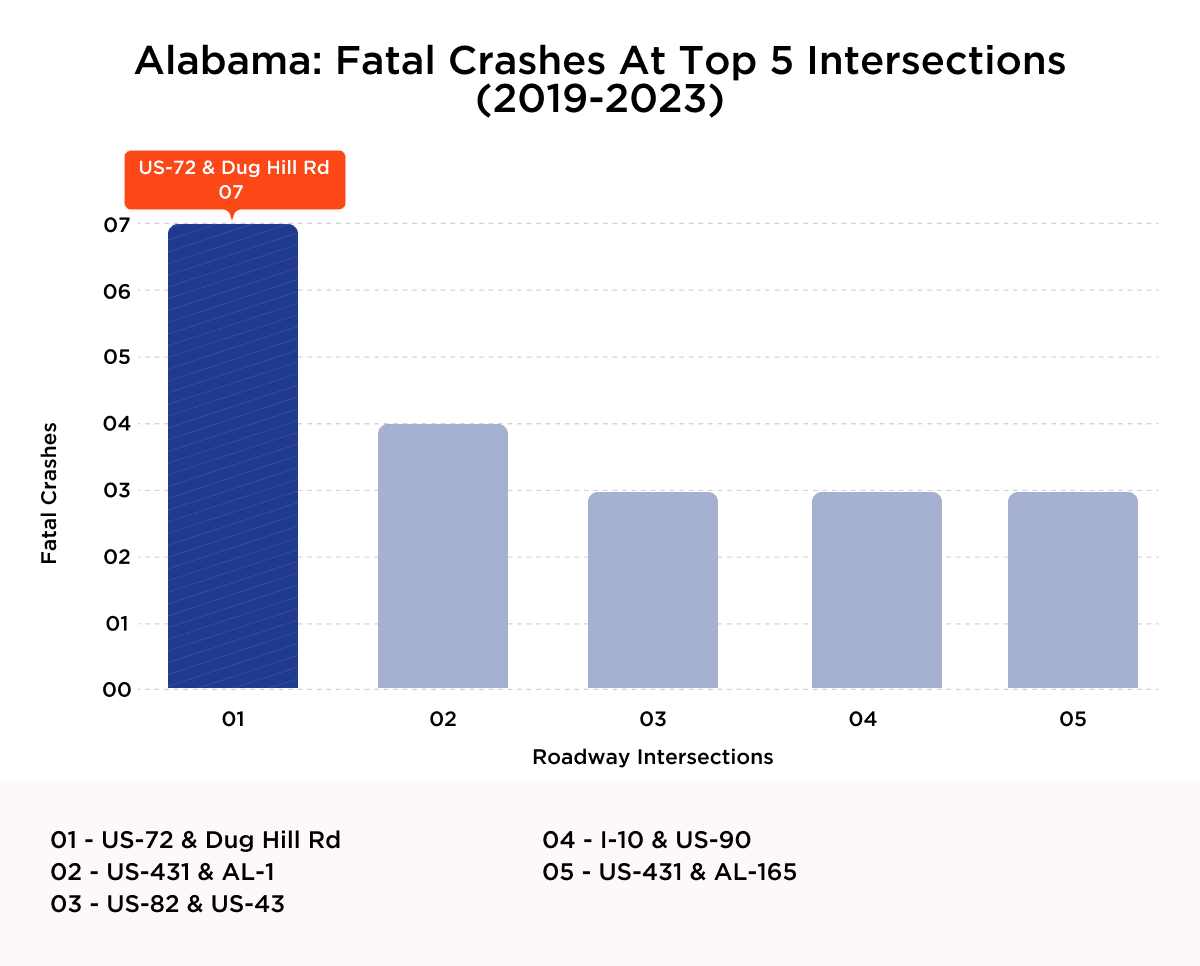
Source: Alabama Traffic Crash Facts Booklet and FARS
8. Tennessee
Tennessee’s most hazardous intersections span both city centers and rural highways. In places like Nashville and Memphis, crash risk is driven by volume and complexity. Outside the cities, roads like US-41 & Rock Island Road face fatal outcomes due to limited visibility and high-speed approaches. Whether urban or rural, these sites reflect mismatches between road use and road readiness, conditions that often carry legal implications when preventable harm occurs.
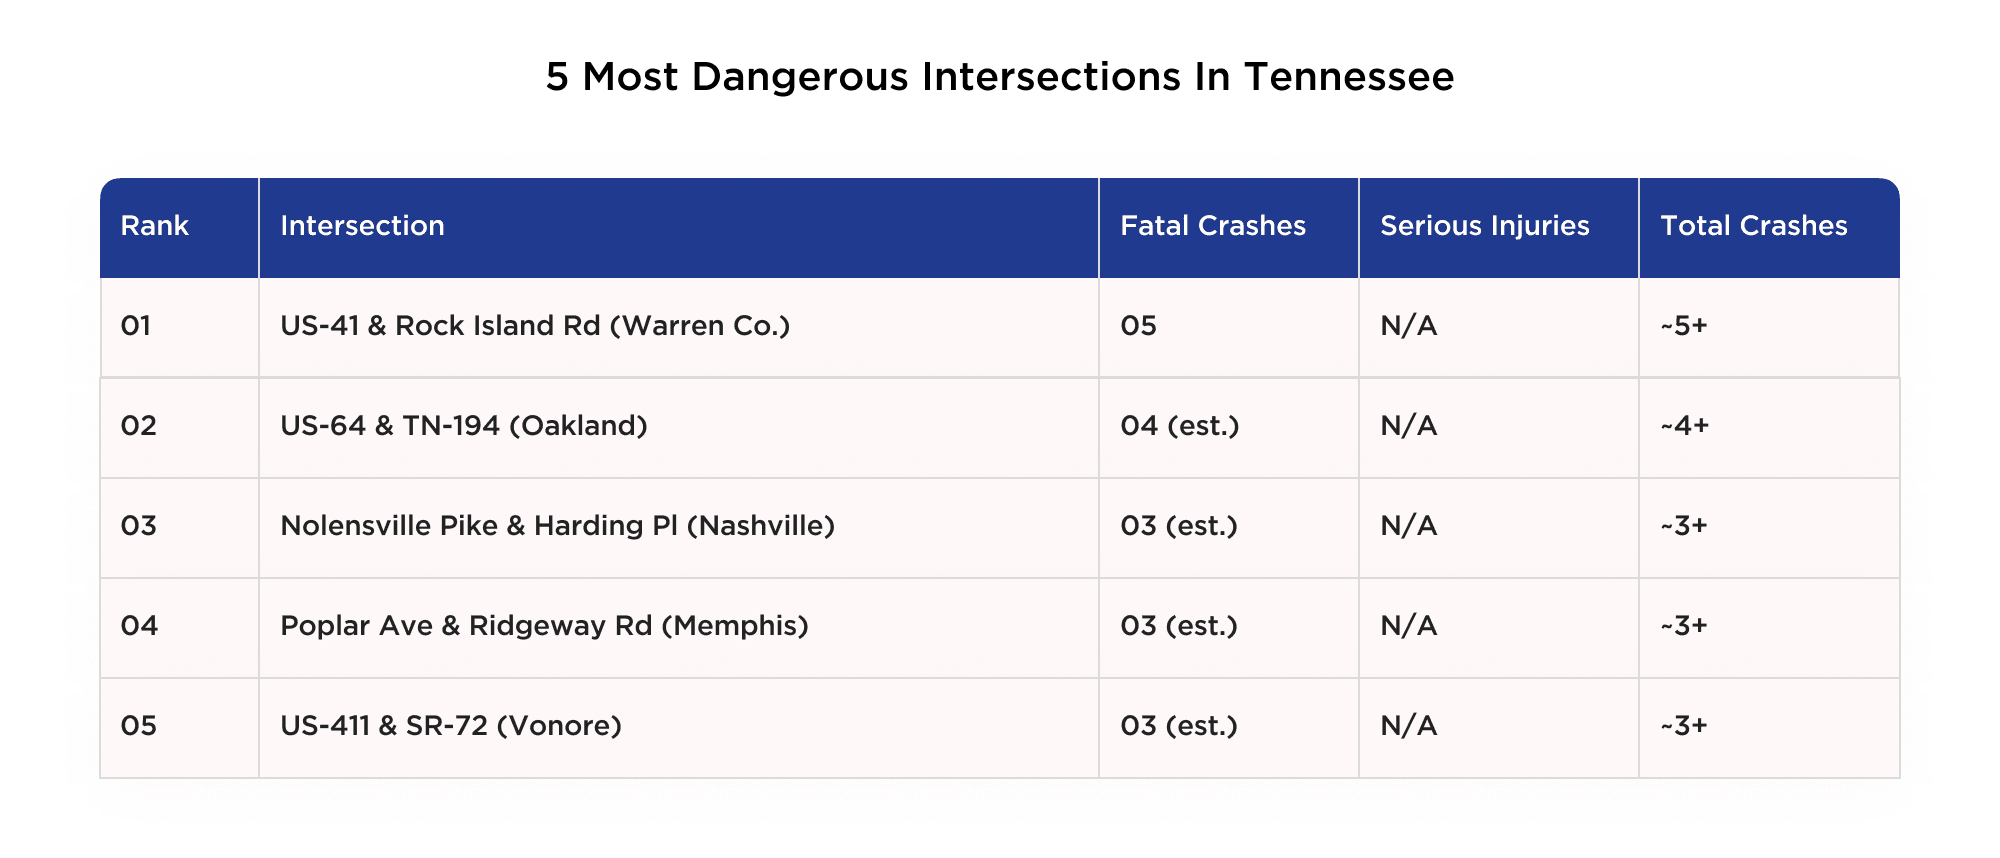
Source: Crash Data Analysis Network (CDAN)
Tennessee’s fatal crash data spans both remote and metro areas, underscoring that risk isn’t tied to location alone. When deadly outcomes occur in such varied settings, it raises questions about whether known design flaws or safety gaps were left unaddressed despite differing traffic conditions.
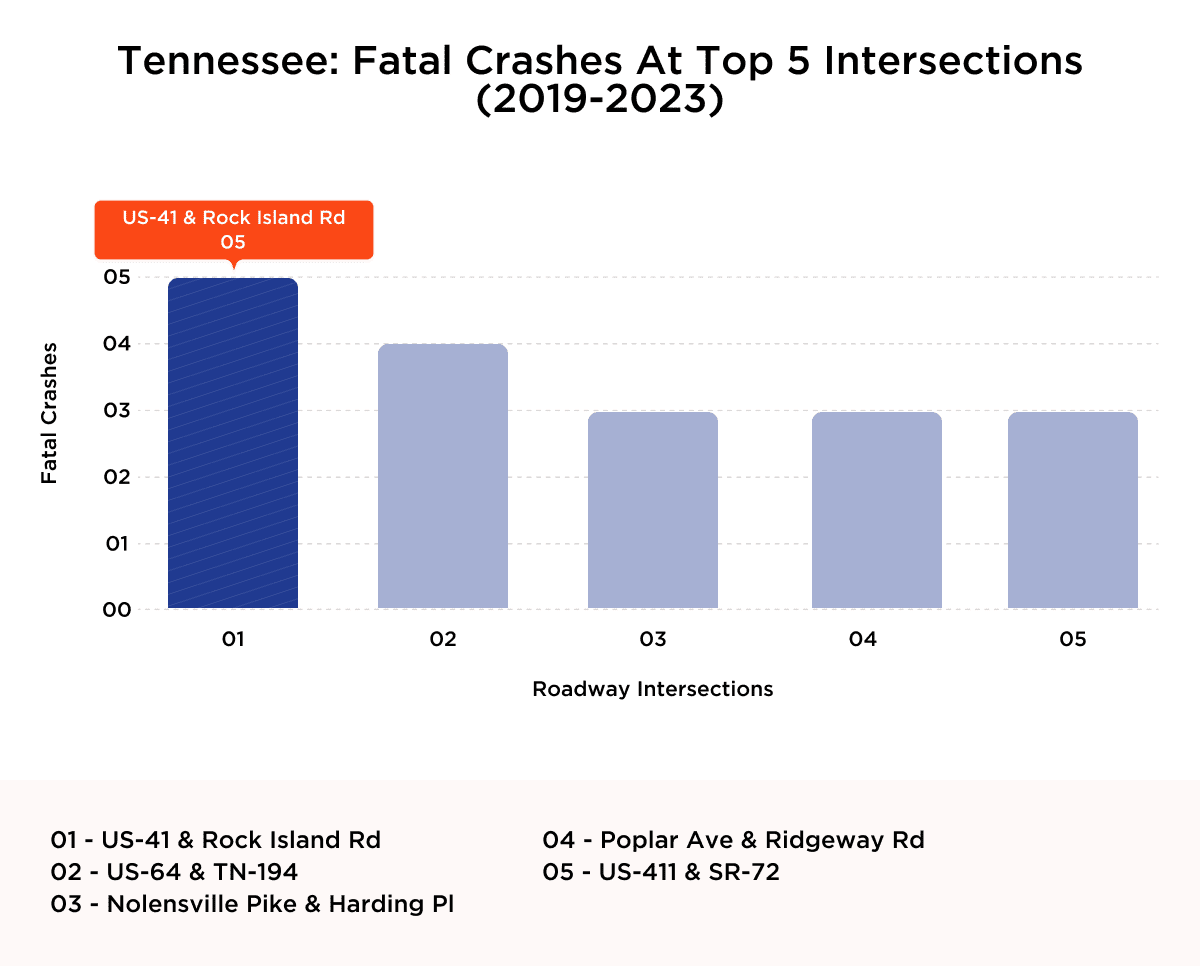
Source: Tennessee Crash Data and FARS
9. North Carolina
North Carolina’s top crash sites reflect equal risk in both rural and metro areas. Intersections like Old Stage Road and General Howe Road still rely on outdated layouts, now strained by suburban expansion. As traffic increases, so does exposure to known hazards, conditions that may carry legal weight in the event of serious crashes.
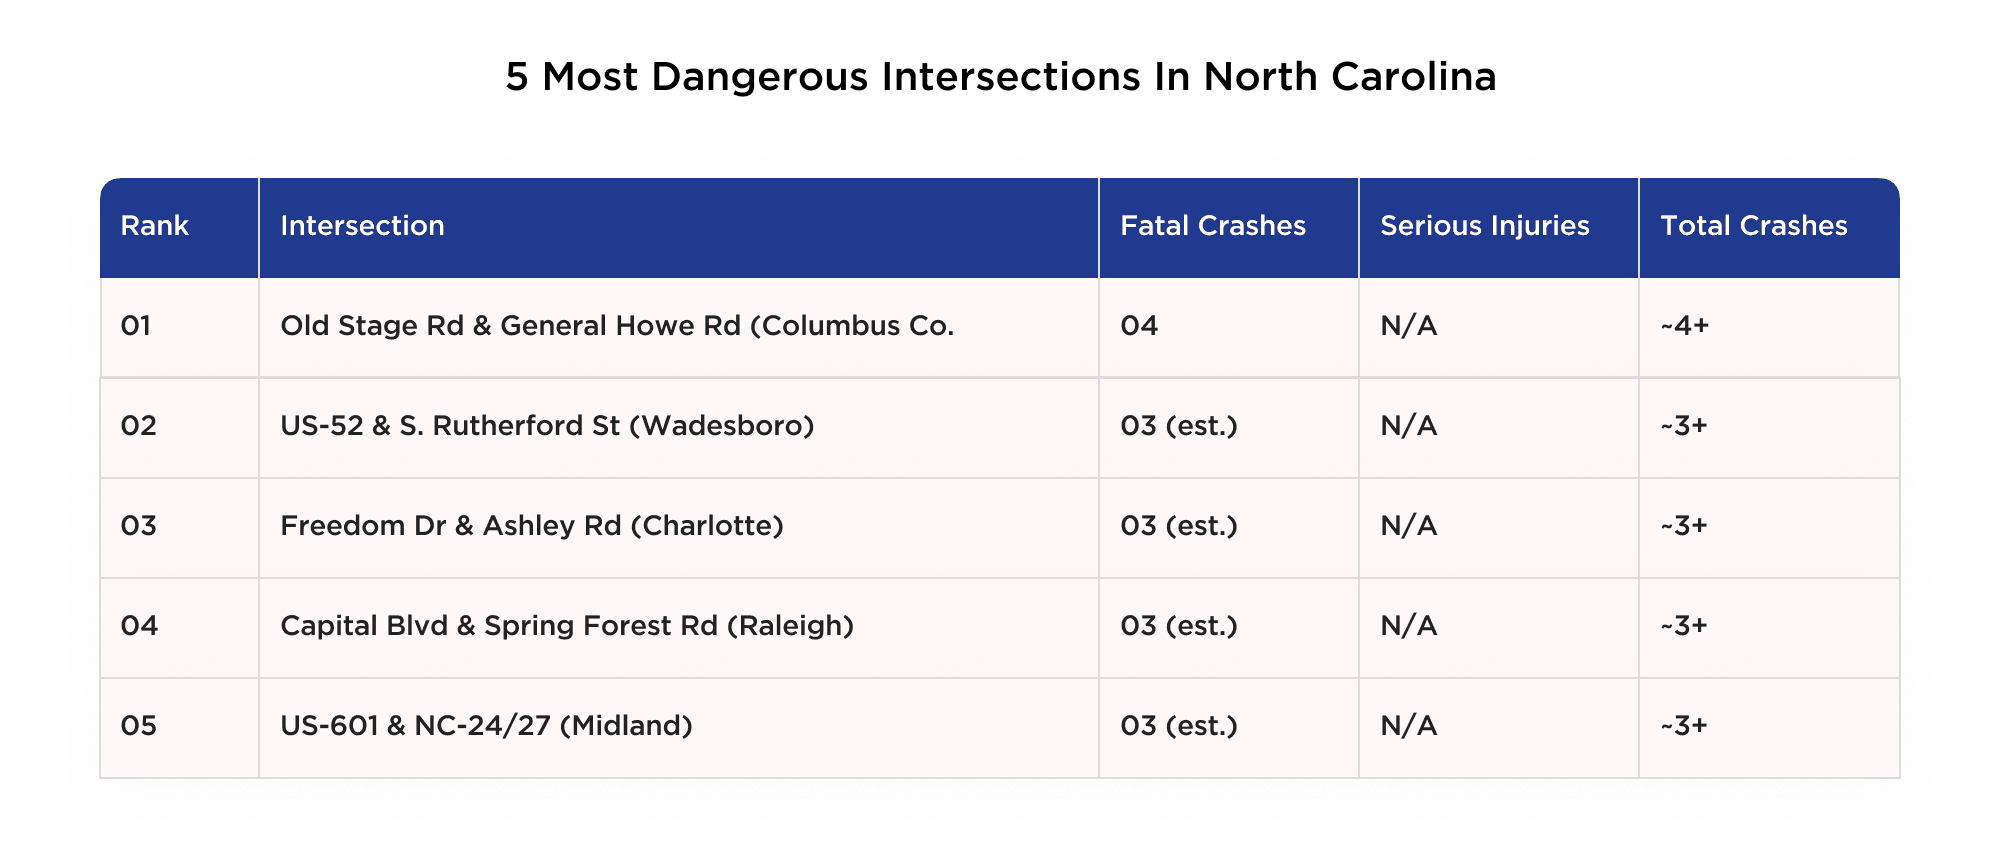
Source: Crash Data Analysis Network (CDAN)
The crash chart for North Carolina shows fatal outcomes across both urban and rural intersections, confirming the risk is widespread. For legal professionals, this reinforces the need to evaluate whether responsible parties took appropriate action, regardless of location, once patterns of danger became clear.
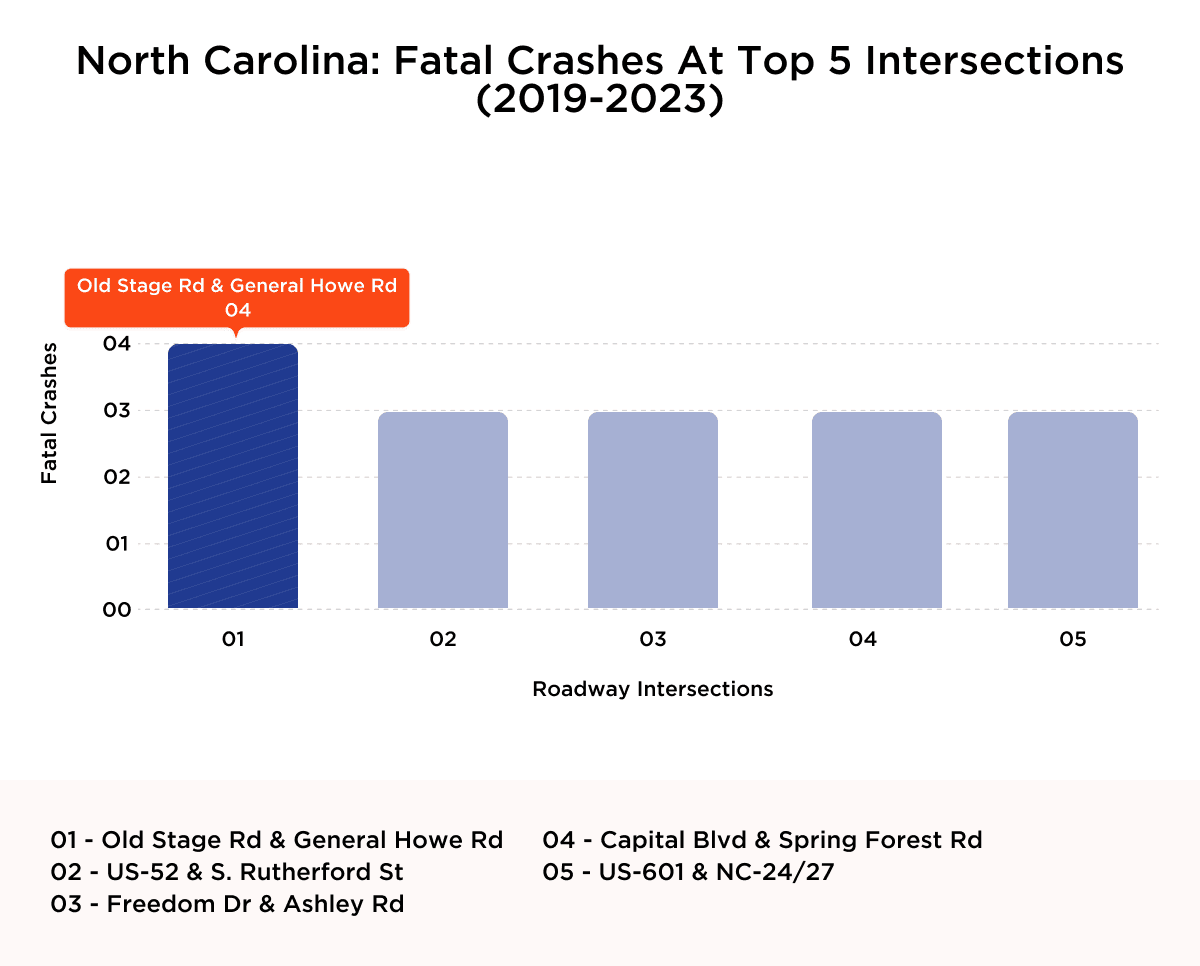
Source: North Carolina Department of Transportation and FARS
10. Louisiana
Louisiana’s intersection fatality data is heavily concentrated in Baton Rouge, underscoring the significant safety challenges posed by rapidly growing urban centers with aging infrastructure. Four out of the state’s five deadliest intersections are located within the city, highlighting a localized pattern of danger that calls for immediate attention.
Florida Boulevard is a particularly alarming corridor. It appears in three separate high-fatality intersections, suggesting not just isolated issues but a systemic failure in corridor-wide traffic planning.
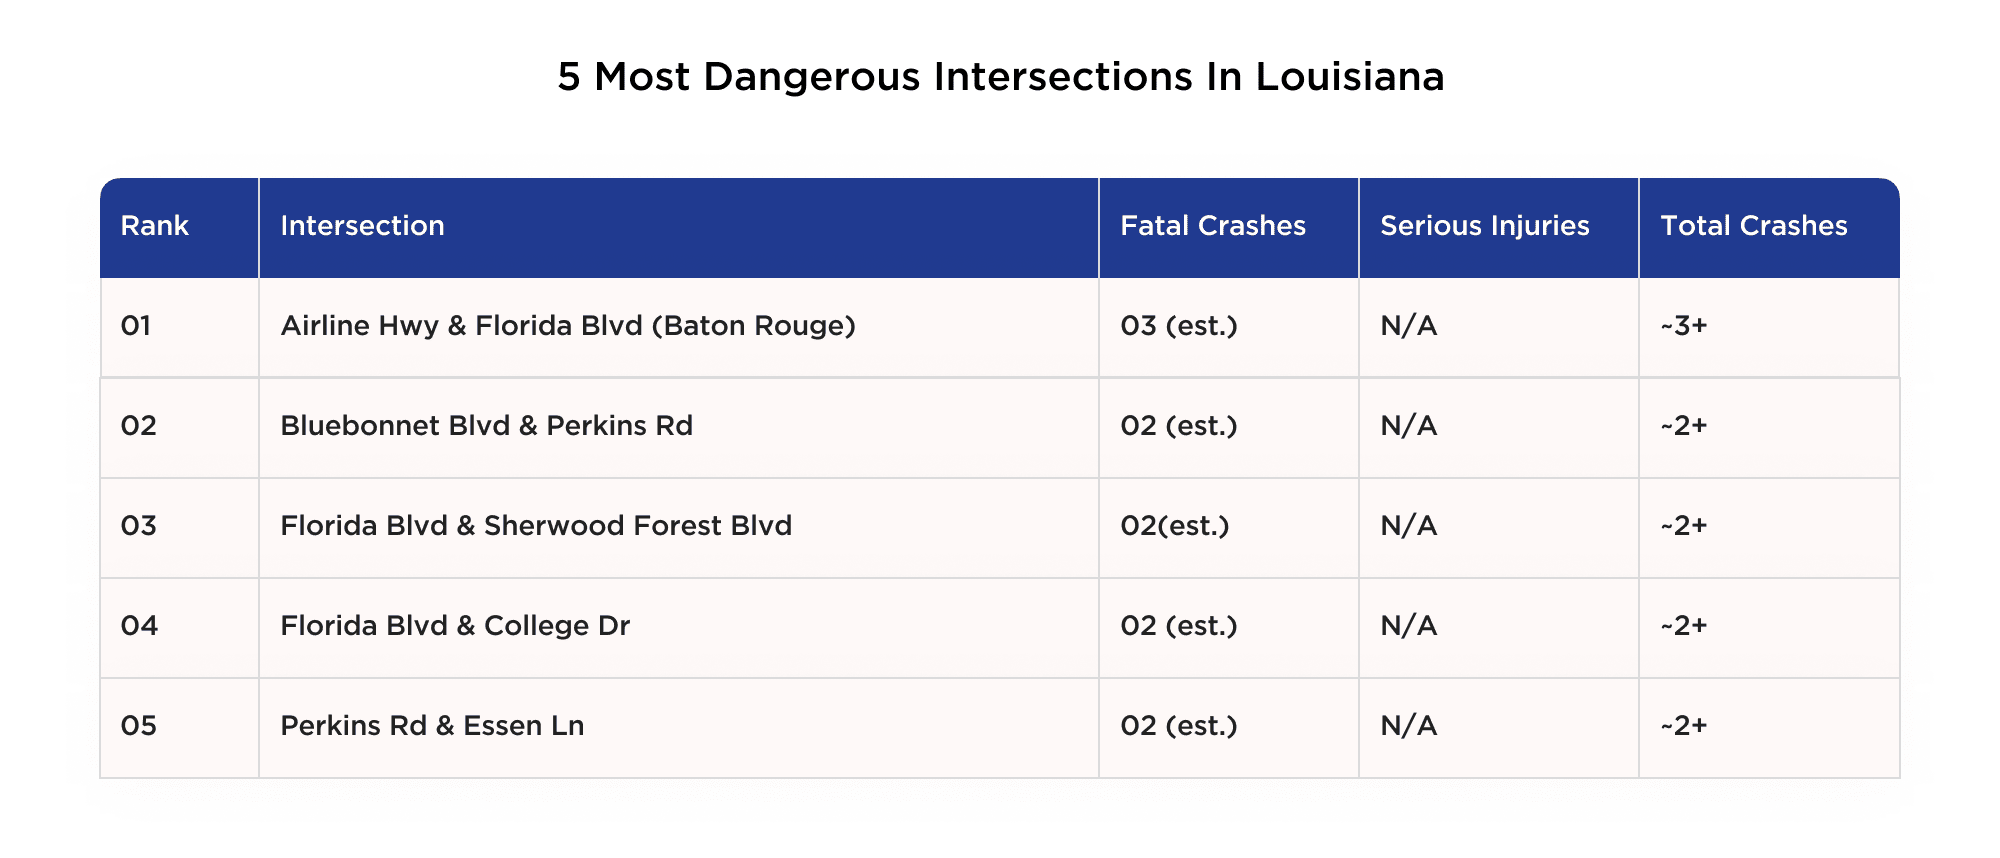
Sources: Crash Data Analysis Network (CDAN)
The fatal crash chart for Louisiana reflects this concentration. Intersections along Florida Boulevard and other major city arteries dominate the top five, with Airline Highway & Florida Boulevard leading the list. The clustering of fatal crashes within a single urban area highlights the potential for claims related to the failure to address known risks on time and underscores an urgent need for sustained investment.
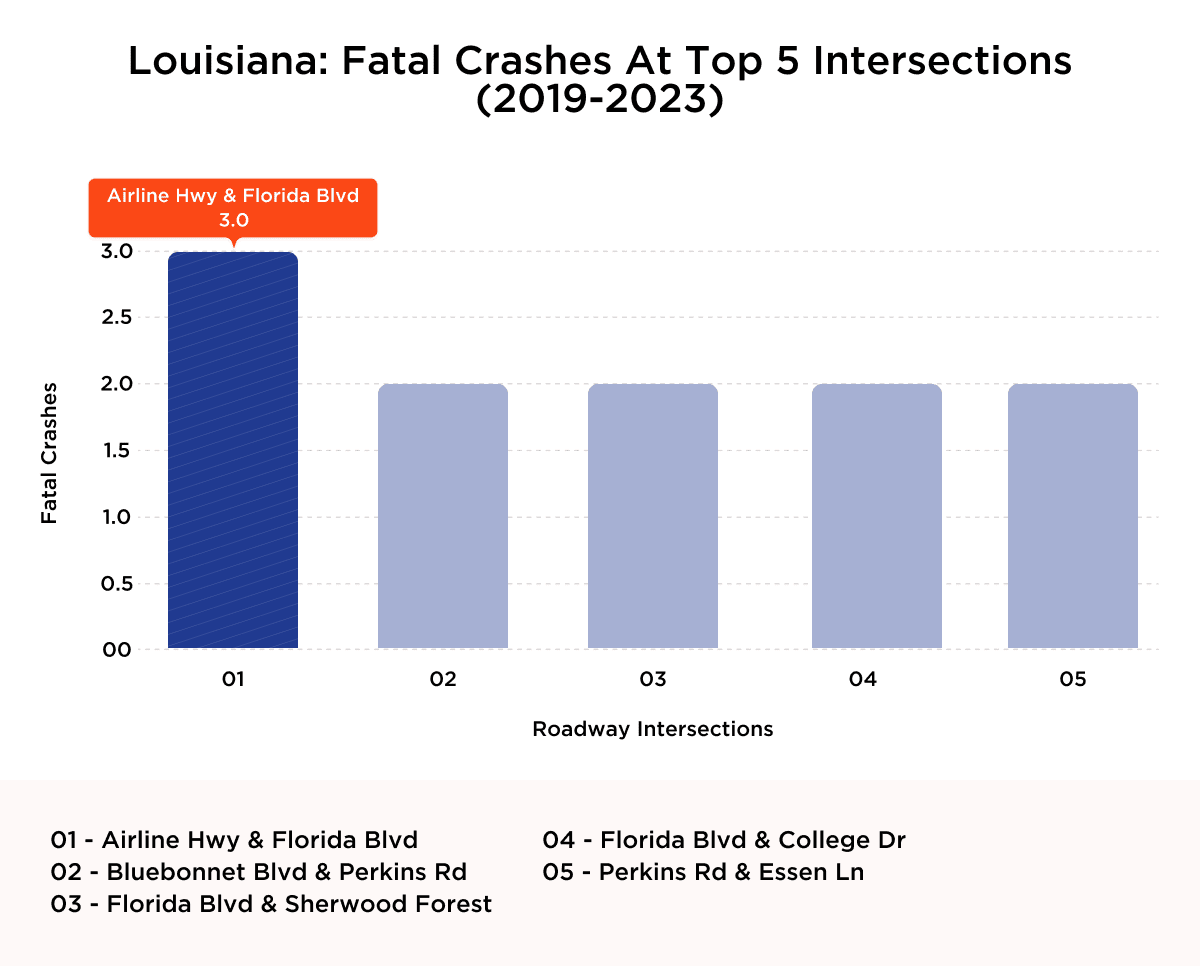
Source: LSP Crash Reports and FARS
Where Crashes Turn Deadly and Why It Matters Legally
Behind every fatal crash is more than just flawed infrastructure. There’s often a preventable cause, a missed safety measure, or a traffic control failure that could have saved a life. In this section, we analyze the regional patterns that have emerged across the South’s most hazardous intersections, as they reflect a broader crisis in roadway oversight. For accident victims and their families, these failures can be legally significant.
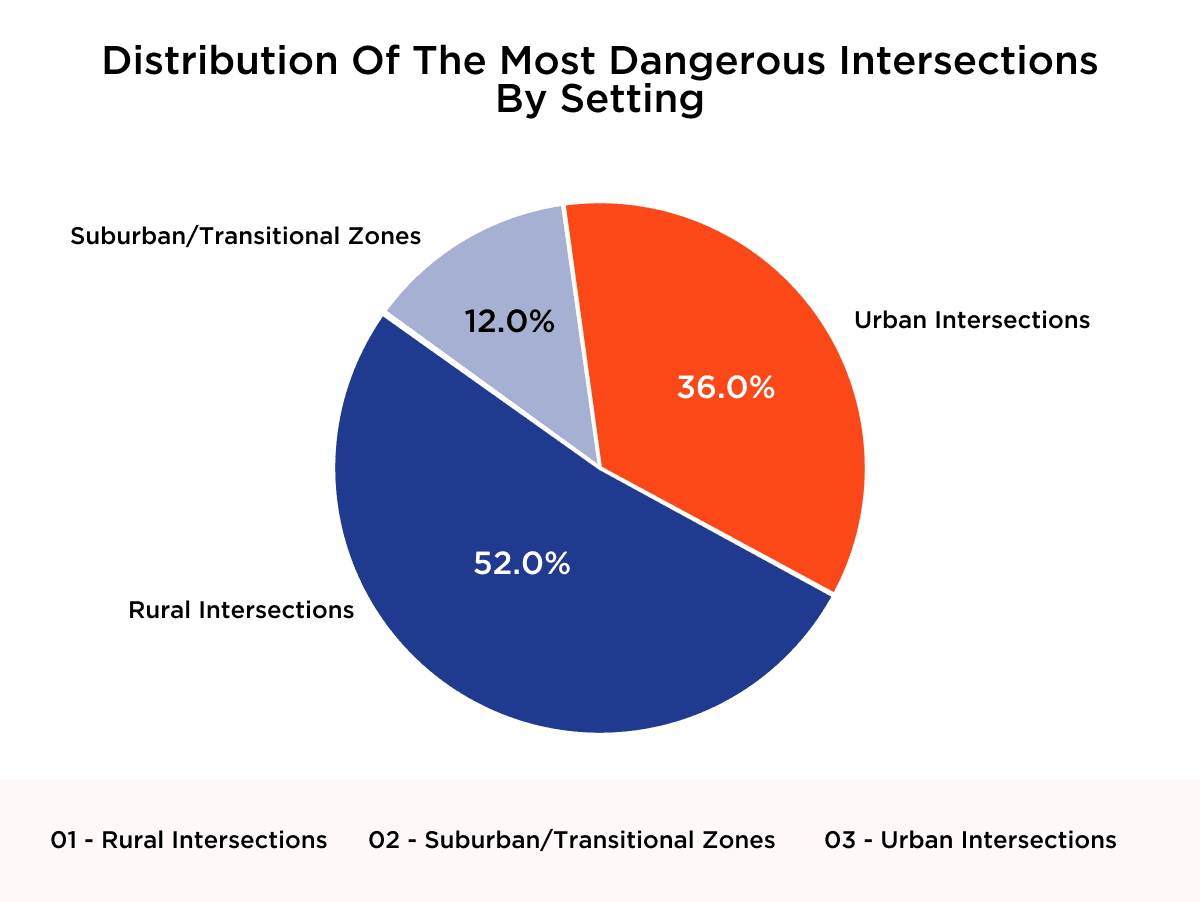
- Urban vs. rural negligence: Fatal crashes occur in both city centers and rural areas. In many rural cases, poor lighting, missing signage, or outdated design may expose agencies to liability for failing to provide basic protections.
- Infrastructure failures: When intersections lack turn lanes, signals, or clear right-of-way indicators—and these gaps are known—public entities may be held accountable, especially after repeated incidents.
- Tourism and commercial volume: States like Florida and Texas face unique risks from high freight traffic and unfamiliar out-of-state drivers. Intersections not designed for this volume may trigger legal scrutiny in the event of serious crashes.
- Environmental hazards: Poor visibility, inadequate lighting, and worn road markings are all preventable. Their presence in crash reports can strengthen legal claims tied to maintenance failures.
Repeated fatalities: An intersection with a documented crash history and no corrective action is more than a safety issue—it’s a potential liability. Courts often view recurring fatalities as evidence of foreseeable risk.
When an intersection is known for repeated crashes, it raises important questions: Was the local or state government aware of the issue? Were proper upgrades neglected? Could a lack of maintenance or traffic control be considered negligence? For personal injury attorneys, these are critical factors when helping clients pursue justice after serious collisions.
Intersection crash patterns are useful for public safety and legal evaluation. When deaths occur in locations with known risks and no corrective action is taken, it strengthens the case for holding agencies accountable. For personal injury attorneys and wrongful death claimants, this data helps connect preventable conditions to real consequences and the legal rights of those affected.
Turning Data into Action: Legal and Safety Strategies for Safer Southern Roads
For car accident victims and their families, a dangerous intersection becomes a place where a preventable tragedy occurred. While infrastructure upgrades can save lives, they also intersect with legal questions of responsibility. When cities and states fail to address known hazards, those decisions can have real consequences, not just in public safety, but in courtrooms across the South.
As a personal injury law firm, we see firsthand how poor planning, ignored warning signs, and inadequate safety measures can lead to life-altering outcomes. We consider these recommendations as a roadmap for preventing future crashes, avoiding legal liability, and protecting lives before the next collision occurs:
- Audit high-risk intersections: Evaluate signage, visibility, lighting, and signals.
- Address rural safety gaps: Prioritize upgrades in areas where fatal crashes frequently occur.
- Use smart traffic signals: Install adaptive systems in congested areas.
- Target driver education: Focus on high-risk corridors and behaviors.
- Apply traffic-calming tools: Use interim measures such as rumble strips and speed limit signs.
- Base funding on crash data: Prioritize known hotspots, not politics.
- Coordinate across agencies: Clarify who’s responsible before and after crashes.
- Document known dangers: Preserve evidence of ignored warnings and repeat collisions.
- Investigate government liability: Identify when negligence played a role.
- Support legal claims with data: Use crash records to strengthen injury lawsuits.
If applied collectively, these changes could form a framework for preventing future crashes and building more substantial legal grounds for holding negligent entities accountable. For this reason, we also view this study as a tool for those seeking justice. Whether through legal action, policy reform, or public pressure, change must come. At Meldon Law, we believe in using data not just to inform, but to advocate for safer roads, for accident victims, and for a system that protects the people who use it every day.